With Pirani manage your indicators with their respective objectives. You can have cross-cutting KCI, KRI and KPI indicators for all management systems, or your own list of indicators for each system.
In Pirani you can create three types of indicators:
KRI (Key Risk Indicators): they are used to measure the organization's exposure to different types of risks, as these indicators provide information on the probability and impact of identified risks.
KPI (Key Performance Indicators): These are used to assess performance, as they provide information on events related to operational losses and allow the quantification of the organization's strategic performance objectives.
KCI (Key Control Indicators): These are used to measure the effectiveness, implementation and operation of controls designed to prevent or respond to risk events.
→ Available in the ORM, AML, Compliance, Audits, and ISMS systems starting from the Enterprise plan.
How are goals created?
Indicators must always be subject to an organizational goal, since their mission is to help achieve that goal.
To create a goal go to the left side of the tool, select the Indicators module and click on the "Create goal" button, here you must fill in the following data:
Name of the goal: what it will be called.
Description: detail what it consists of.
Responsible for the goal: who will be in charge of supervising its fulfillment.
Cycle: the annual time range where the management of the goal is presented, this helps us to compare it with a specific month of a previous year.
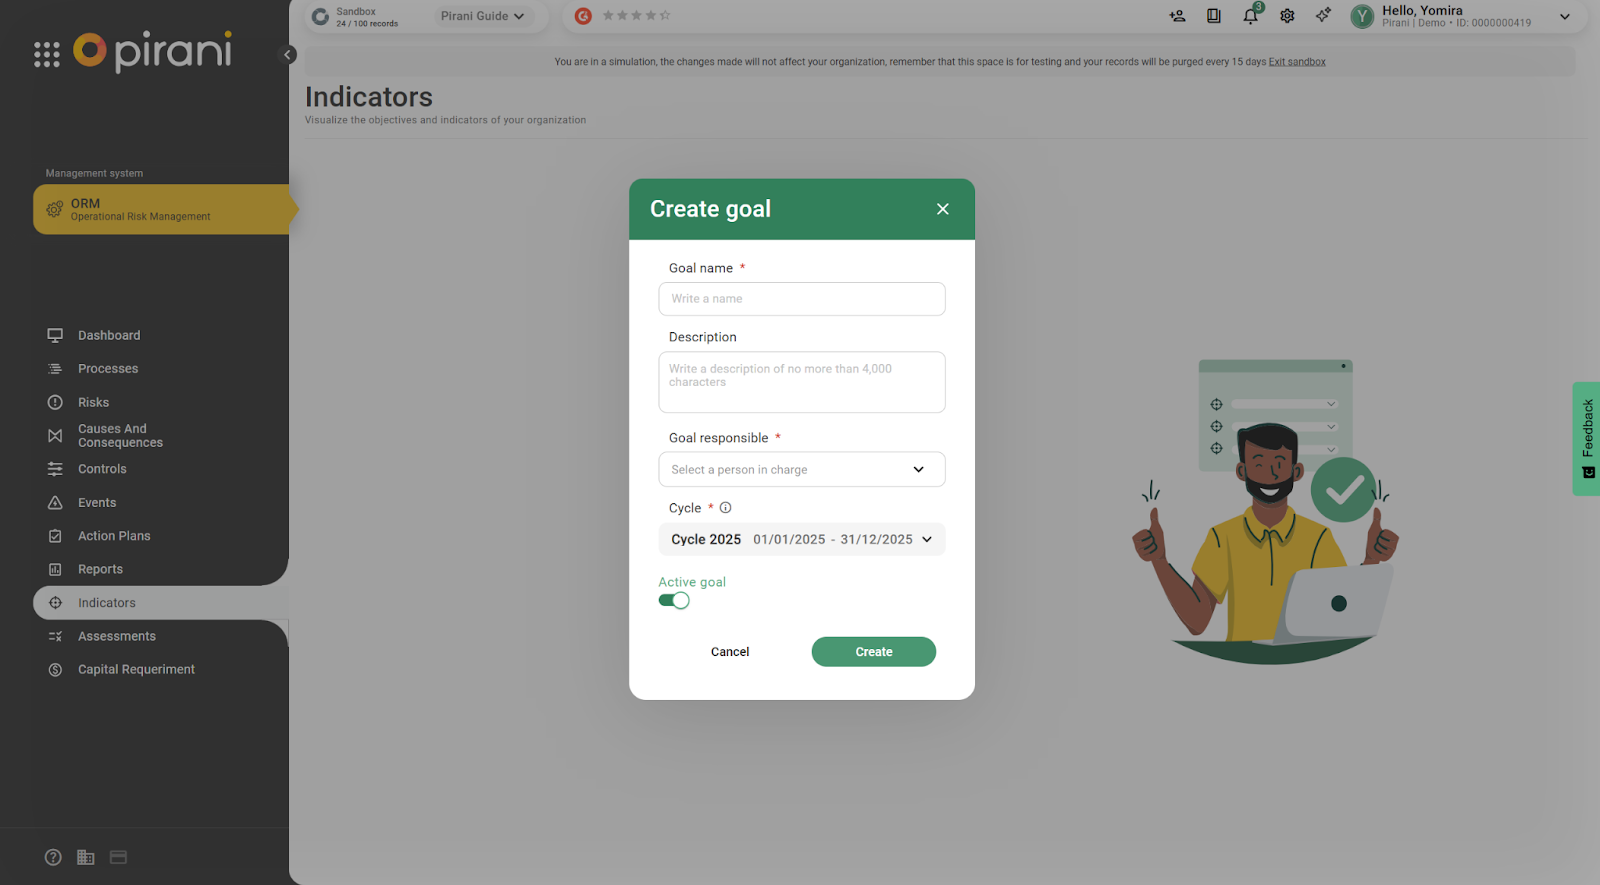
Finally, click on the "Save" button and the goal will be created.
Remember that as you add indicators the first one to be displayed will be the last one added, but you can change the order of how your targets are displayed at any time by selecting and dragging them.
Important: You can deactivate a target if you consider that it is no longer necessary to measure it but you do not want to delete it for historical purposes.
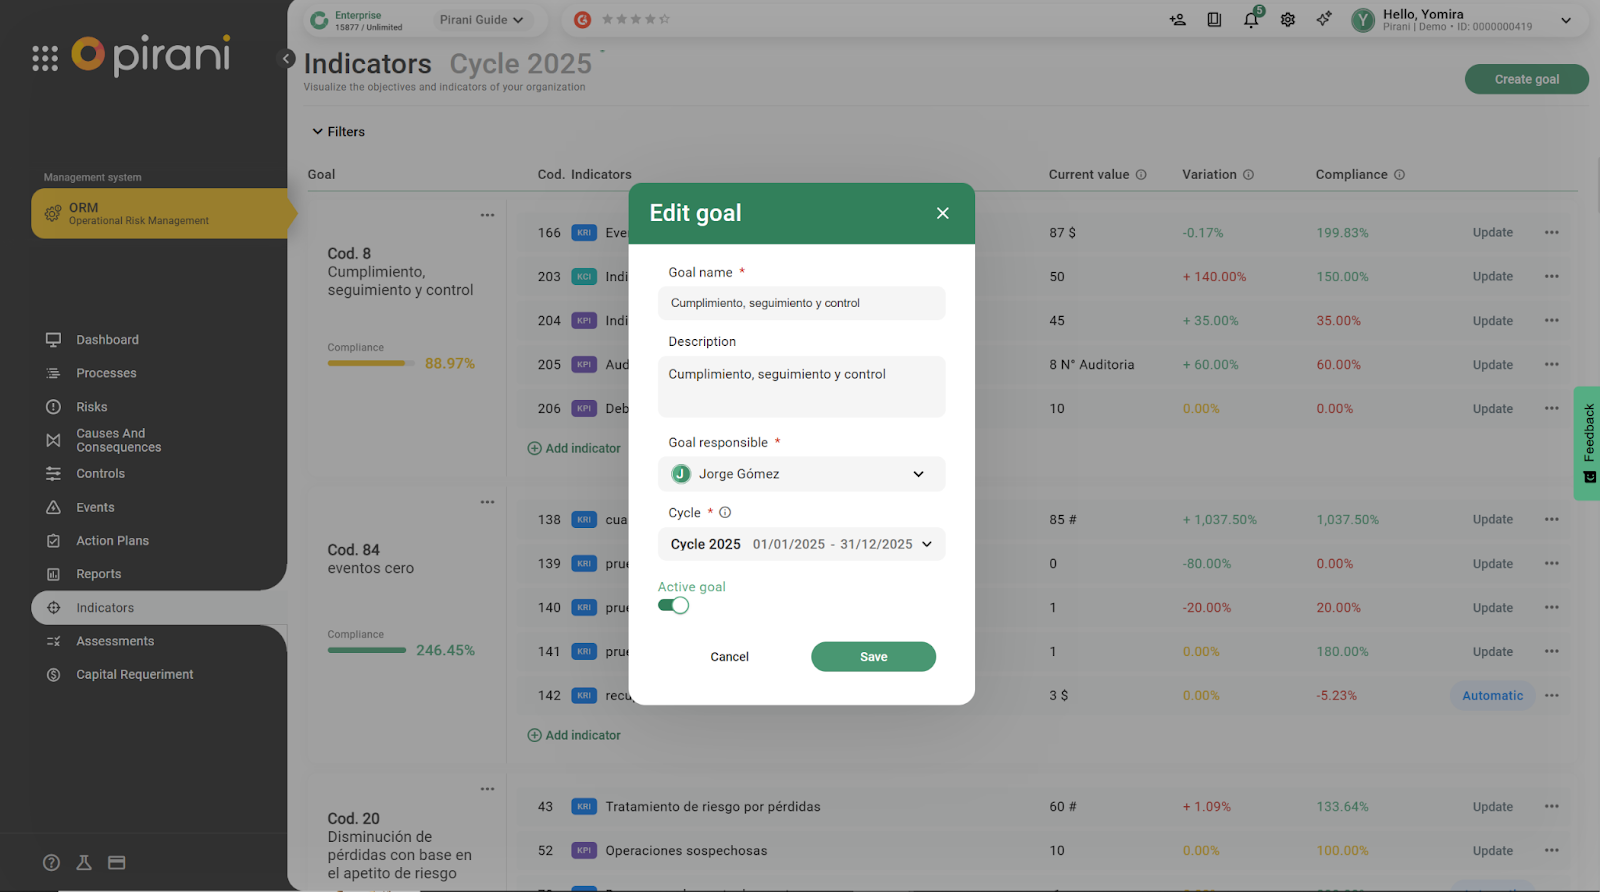
How to edit, delete or inactivate a goal?
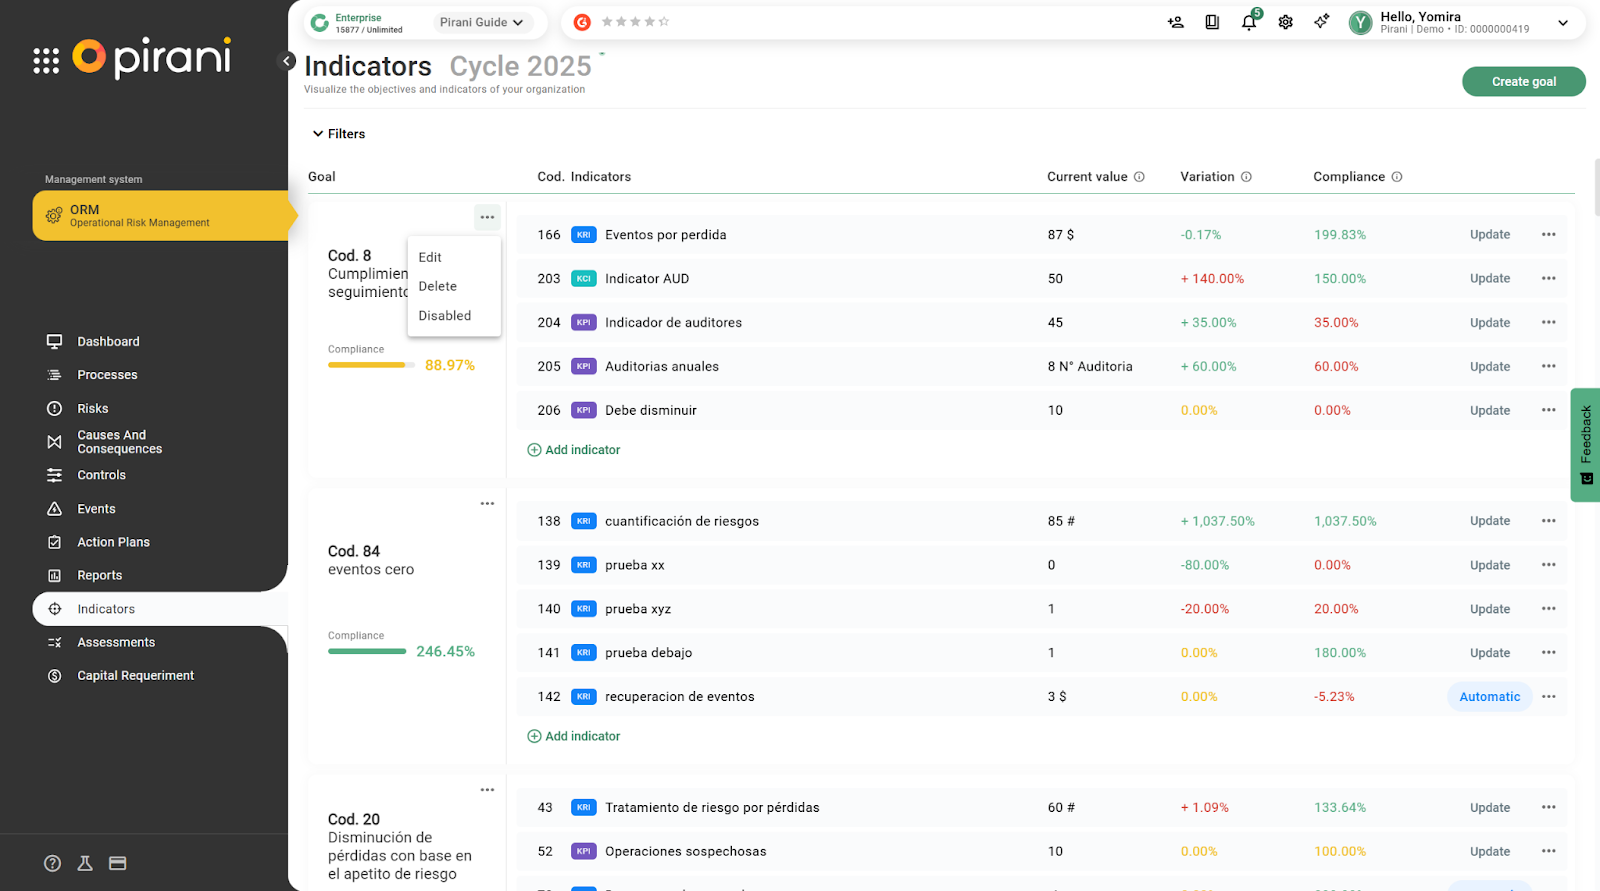
In the upper right corner of your goal click on the three vertical dots that appear, here you will see these options:
Edit: that will allow you to modify any field of the goal.
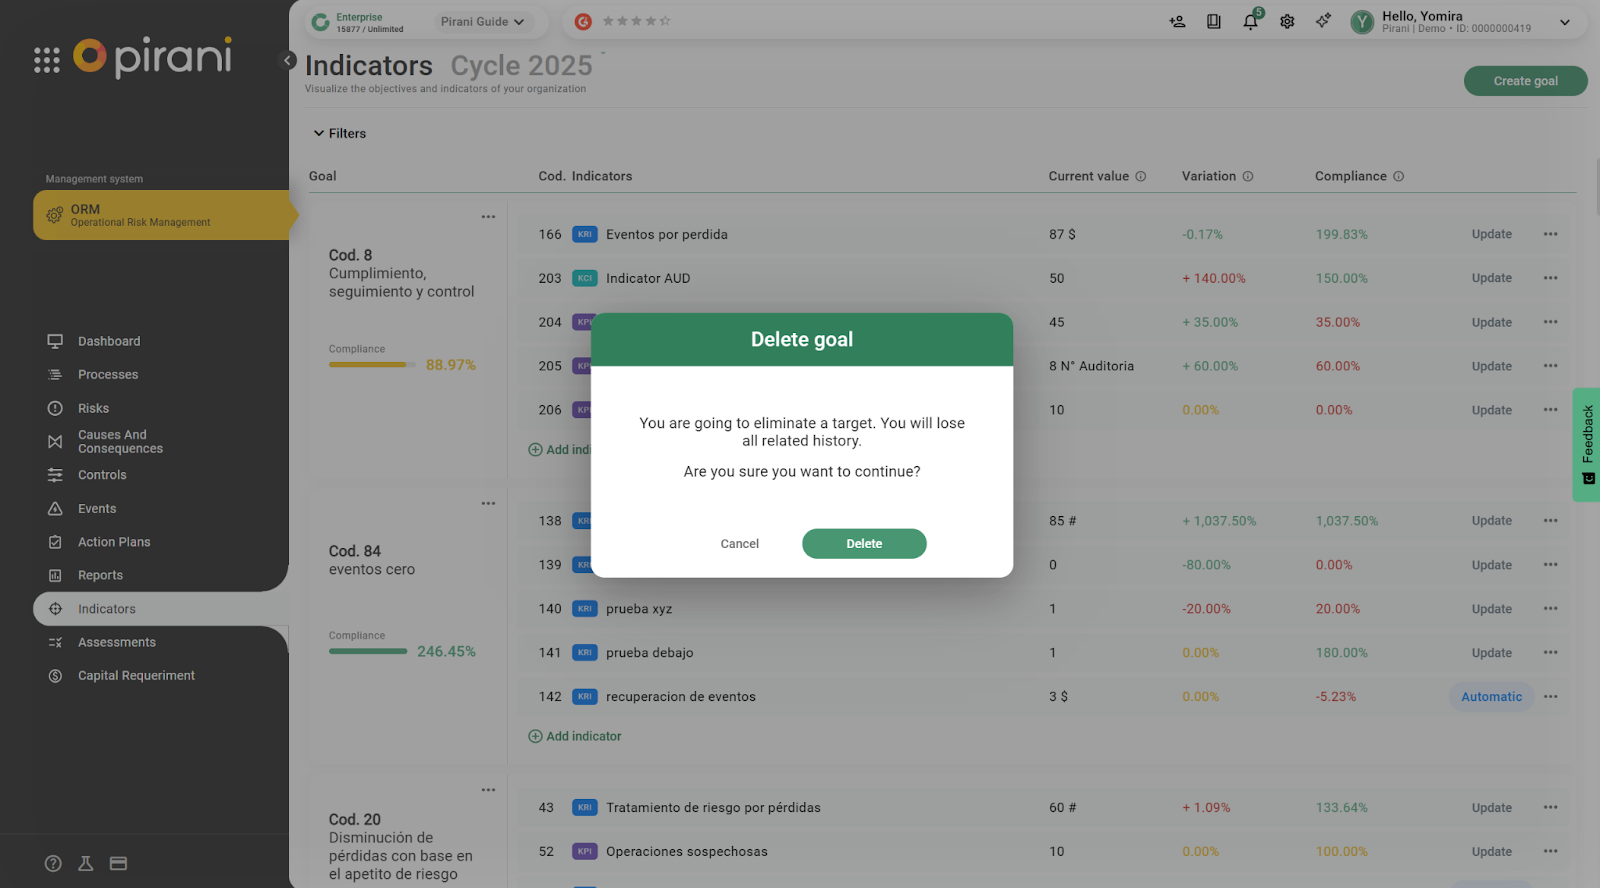
Delete: in case you consider that you no longer want that goal (remember that all related history will be lost).
Deactivate: you will be able to deactivate it in case you no longer wish to follow up the goal (you will also have the option to reactivate it at any time).
How to create an indicator?
Once the objective has been created, you can start associating the indicators. To do this go to the right side of the objective and click on the "Add indicator" button, you will see the "Manual indicator" and "Automatic indicator" options.
Manual indicator:
This indicator is used to have business data such as: the number of customers, number of errors in a system, number of availability, etc.
Within this form you will have to register the following sections:
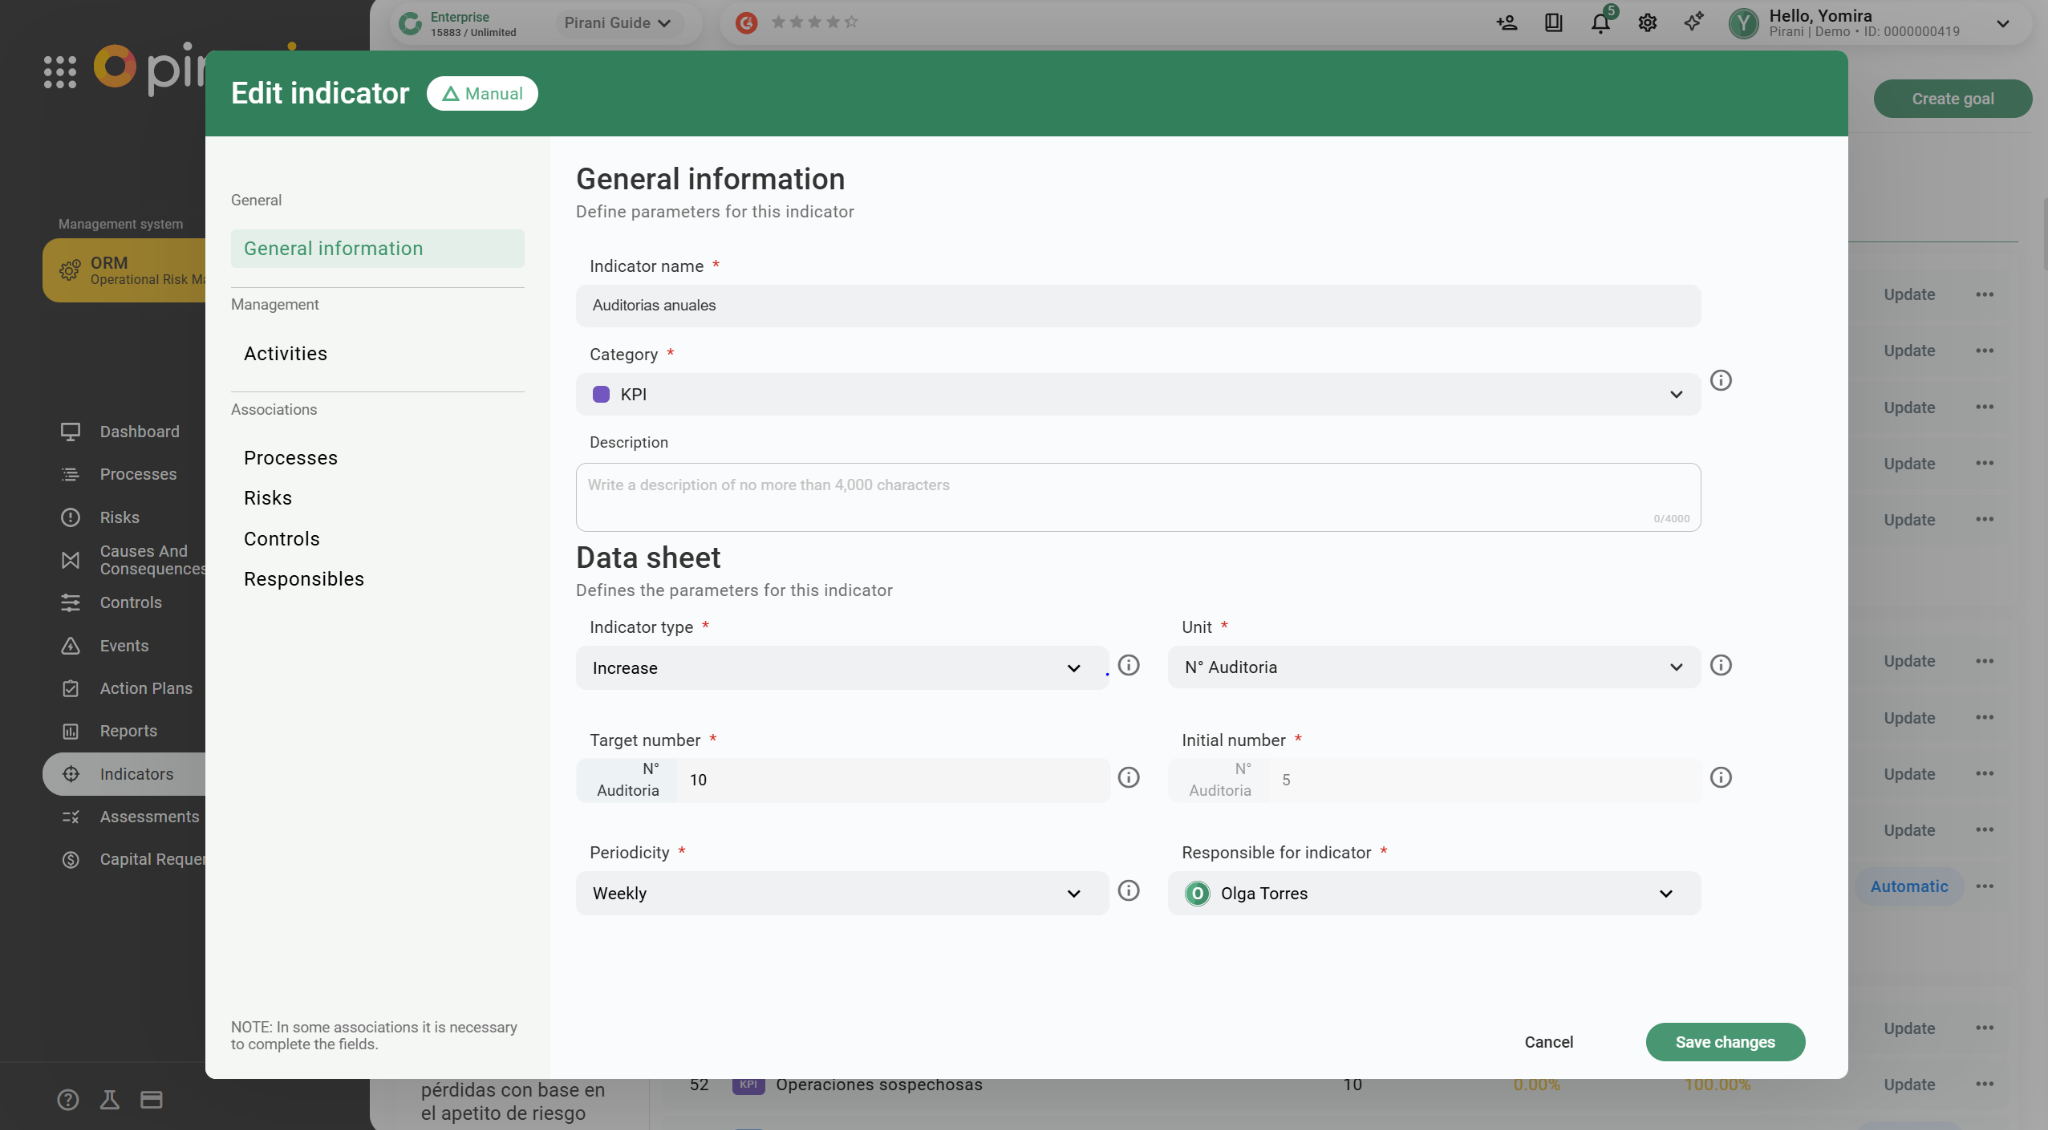
1. General information
Indicator name: what the indicator will be called.
Indicator category: select the indicator category between KCI, KRI and KPI
Description: details how the indicator will be calculated.
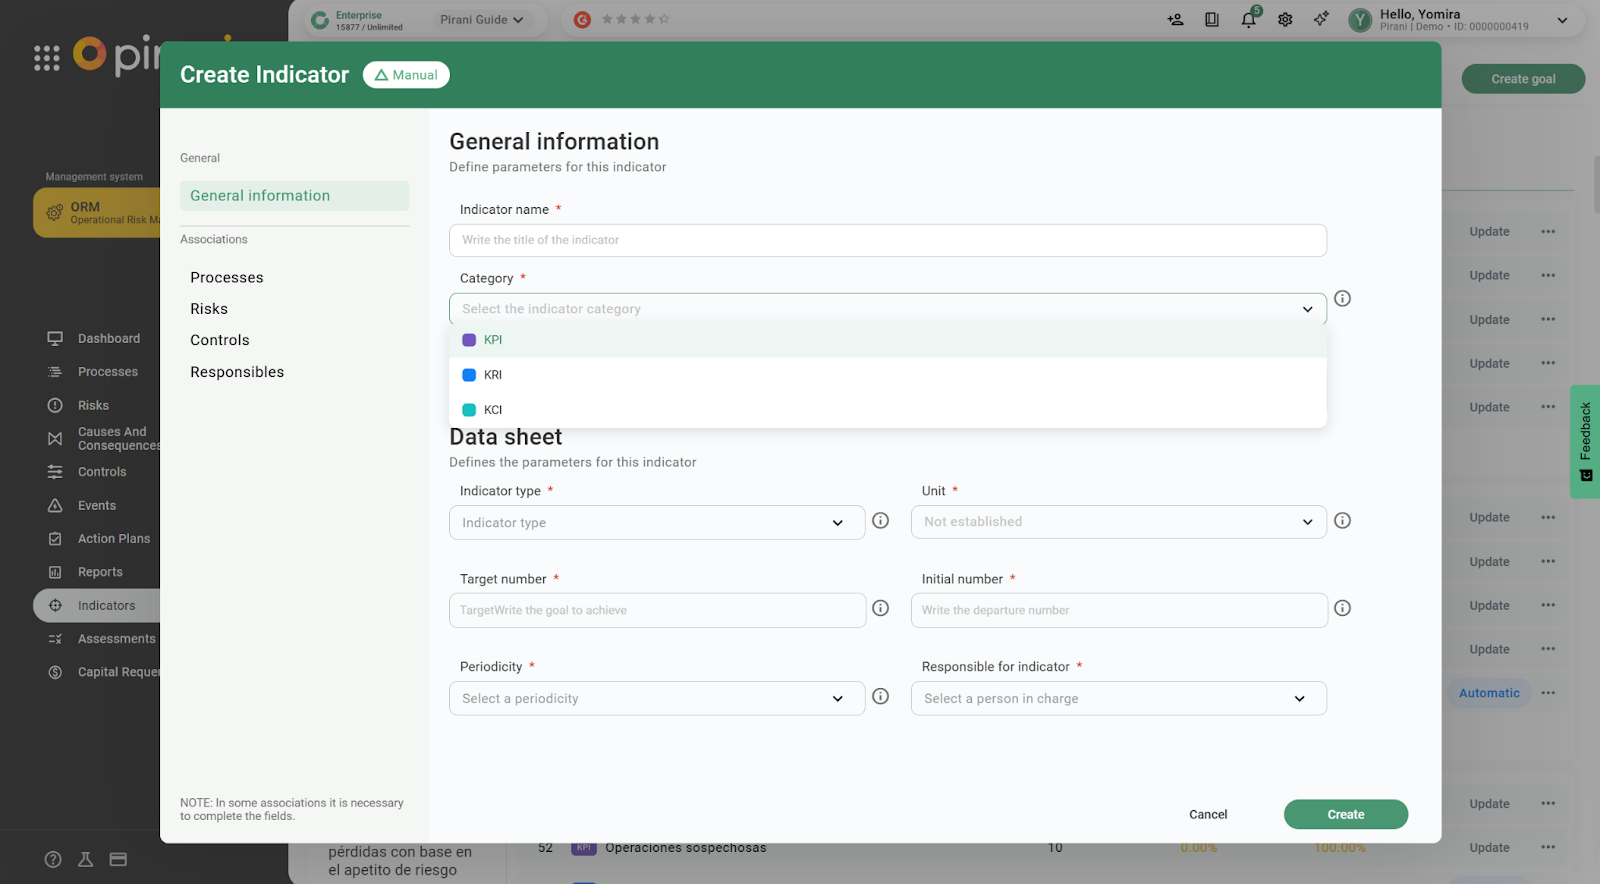
Type of indicator: select whether you want it to be increasing, decreasing, above or below a certain number.
Unit: indicate in which unit of measure you want (hours, amount, percentage, currency or custom).
Important: to create a custom unit, you must enter the name of the unit of measure and determine whether the unit will go at the beginning or end.
Target number: determines what is the target quantity to be reached.
Start number: determines the base measurement of the indicator.
Periodicity: how often you are going to follow up on the indicator's fulfillment.
Responsible for the indicator: designates the person who will be in charge of monitoring the indicator.

Finally, click on the "Create" button.
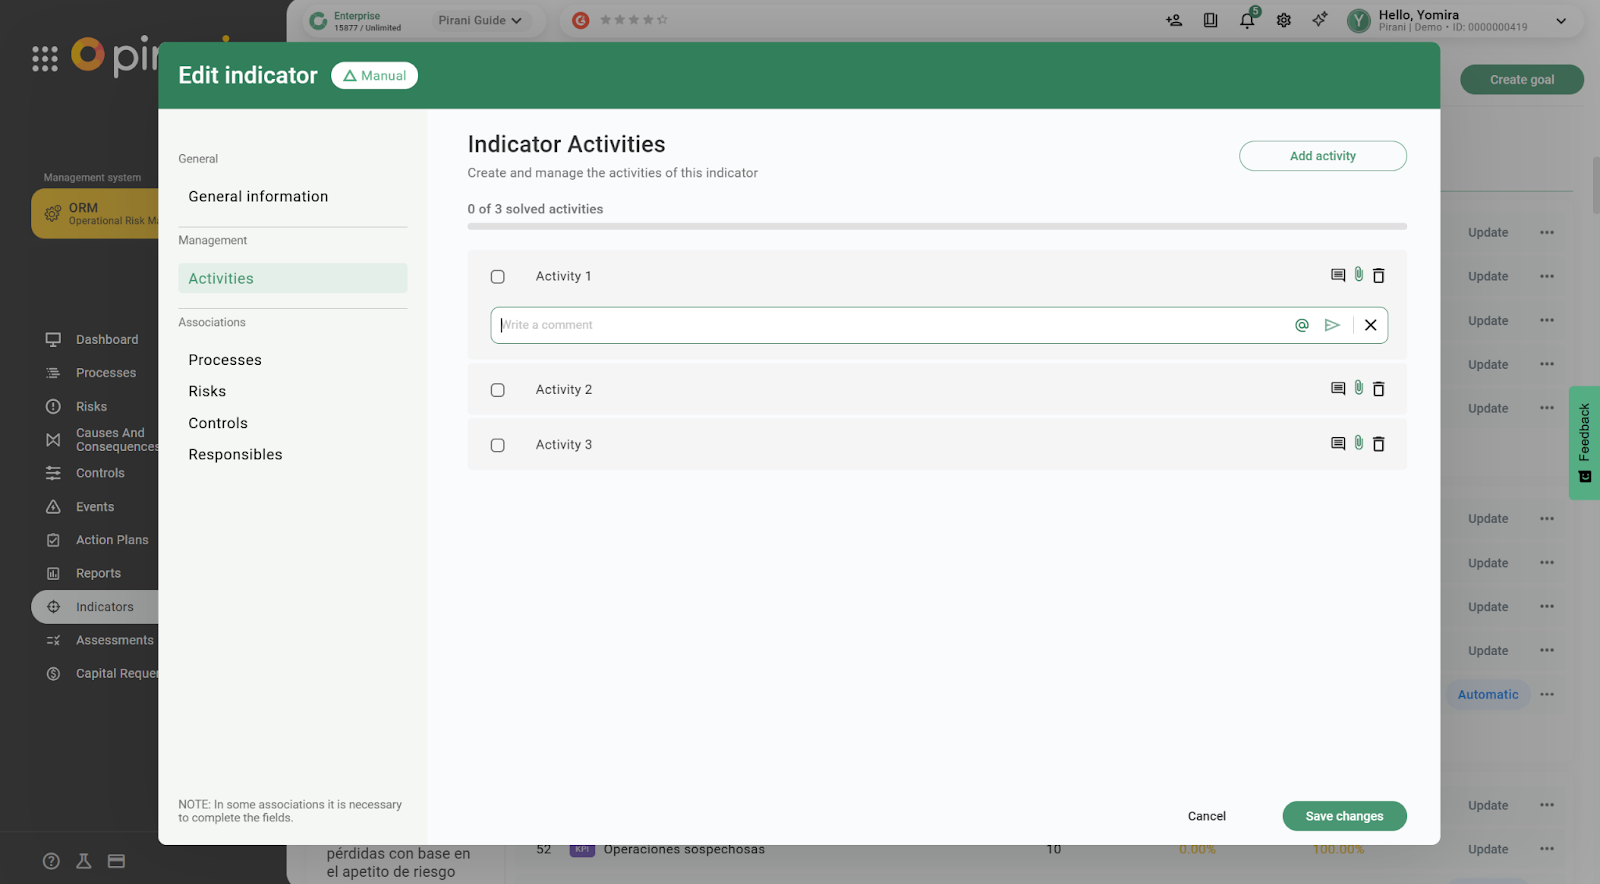
2. Activities
In the "Activities" section, add all the actions that will help you meet the goal of your indicators. Here you can add comments, attach files and change the status of each activity as it develops.
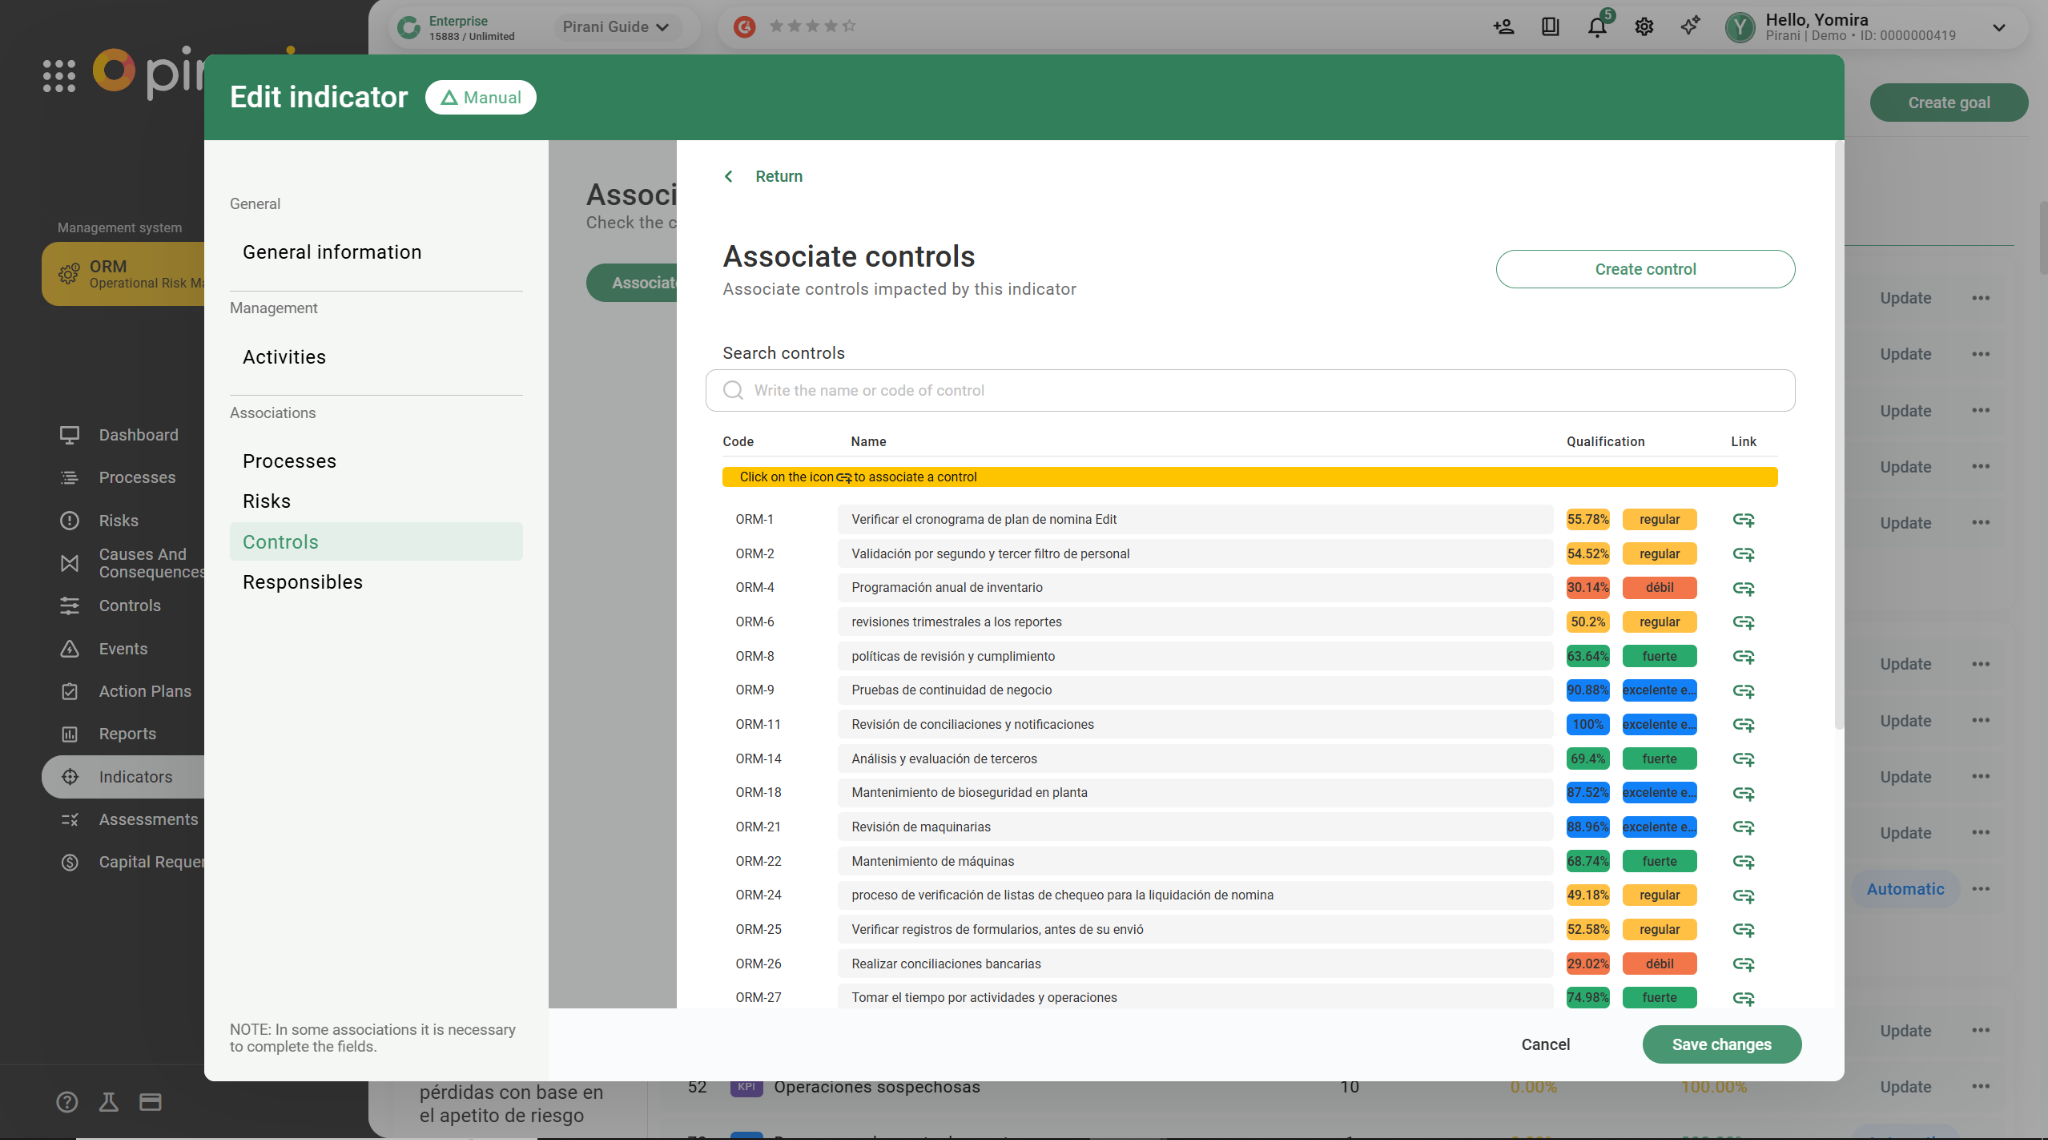
3. Associations
You will be able to associate processes, risks, controls and/or responsible parties according to the indicator you are creating.
To associate click on the "Asociate" button.
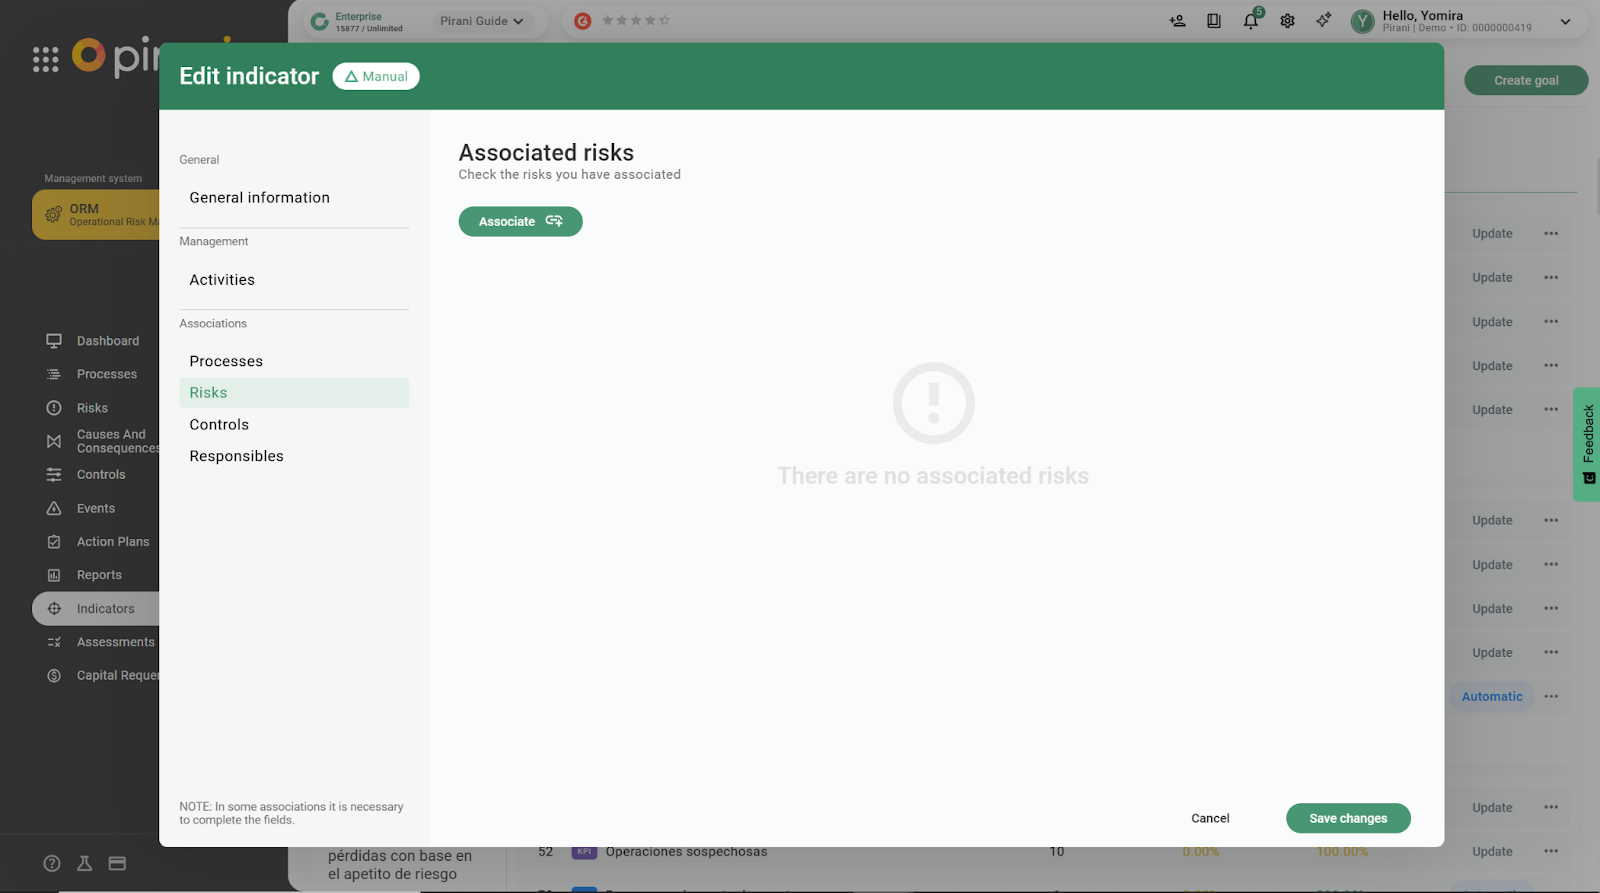
Then click on the "+" icon of the registers you are interested in.
Finally, click on the "Save" button and the indicator will be registered.
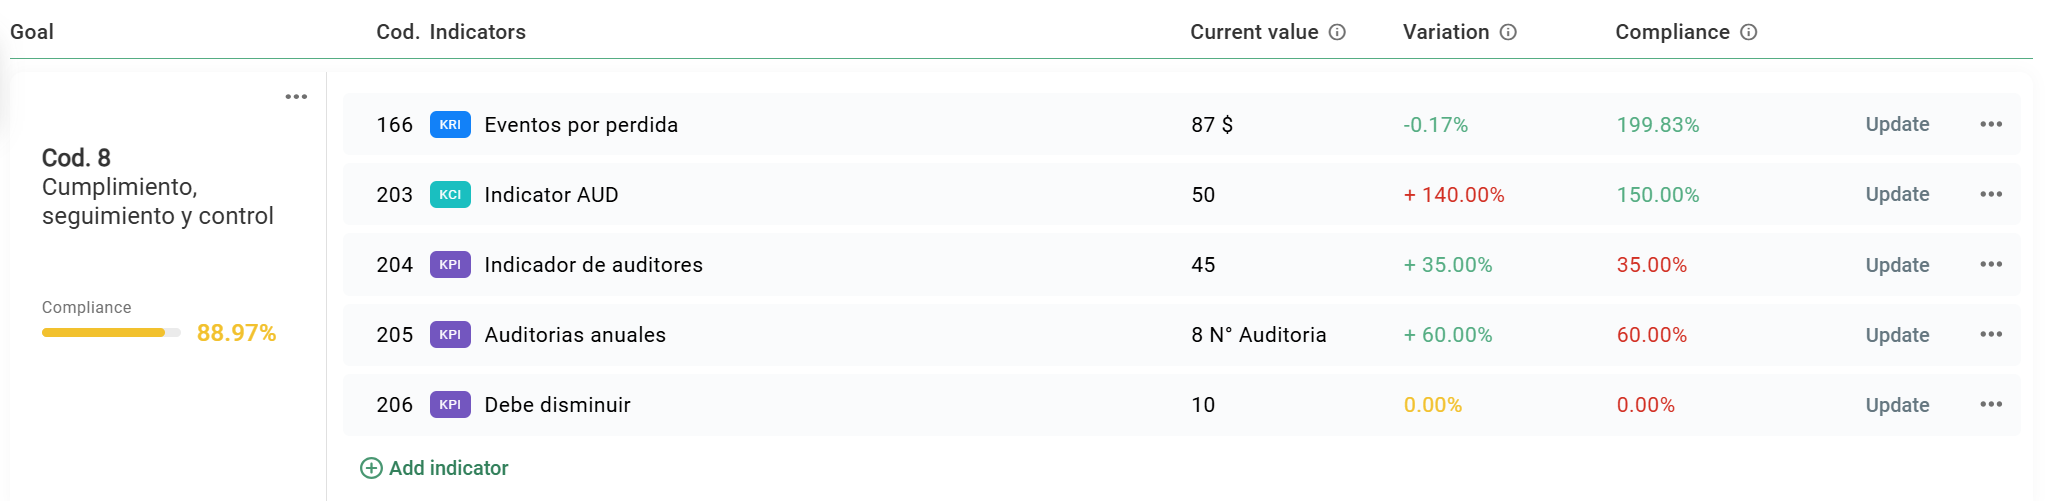
After creating the indicator, you will see in the module dashboard the data divided into 5 columns:
Code: which is the registration number of the indicator.
Indicator: the name of the indicator.
Current value: represents the indicator’s present measurement, which changes based on its scheduled update frequency.
Variation: indicates whether the value went up, down or is stable with reference to the last recorded value.
Compliance: the actual value with respect to the established target.
Automatic indicator:
It is calculated internally based on the records you have from the processes, risks and controls modules. The platform will update the value of the indicators automatically depending on the periodicity assigned to it.
With this indicator you will be able to evaluate the performance of risk management, for example: number of events being generated, number of action plans that are executed or finalized, etc.
Here is a step-by-step tutorial explaining How do automatic indicators work?
How to update an indicator?
On the right side of each indicator you will find the "Update" button, here you can change the current value of the indicator and add a comment to detail information about this change.

How to edit or delete an indicator?
Go to the top right side of the indicator and click on the three horizontal dots where you can select the following options:
Edit: so that you can modify any field of the indicator.
Delete: in case you consider that it is no longer necessary to have the indicator within the target.
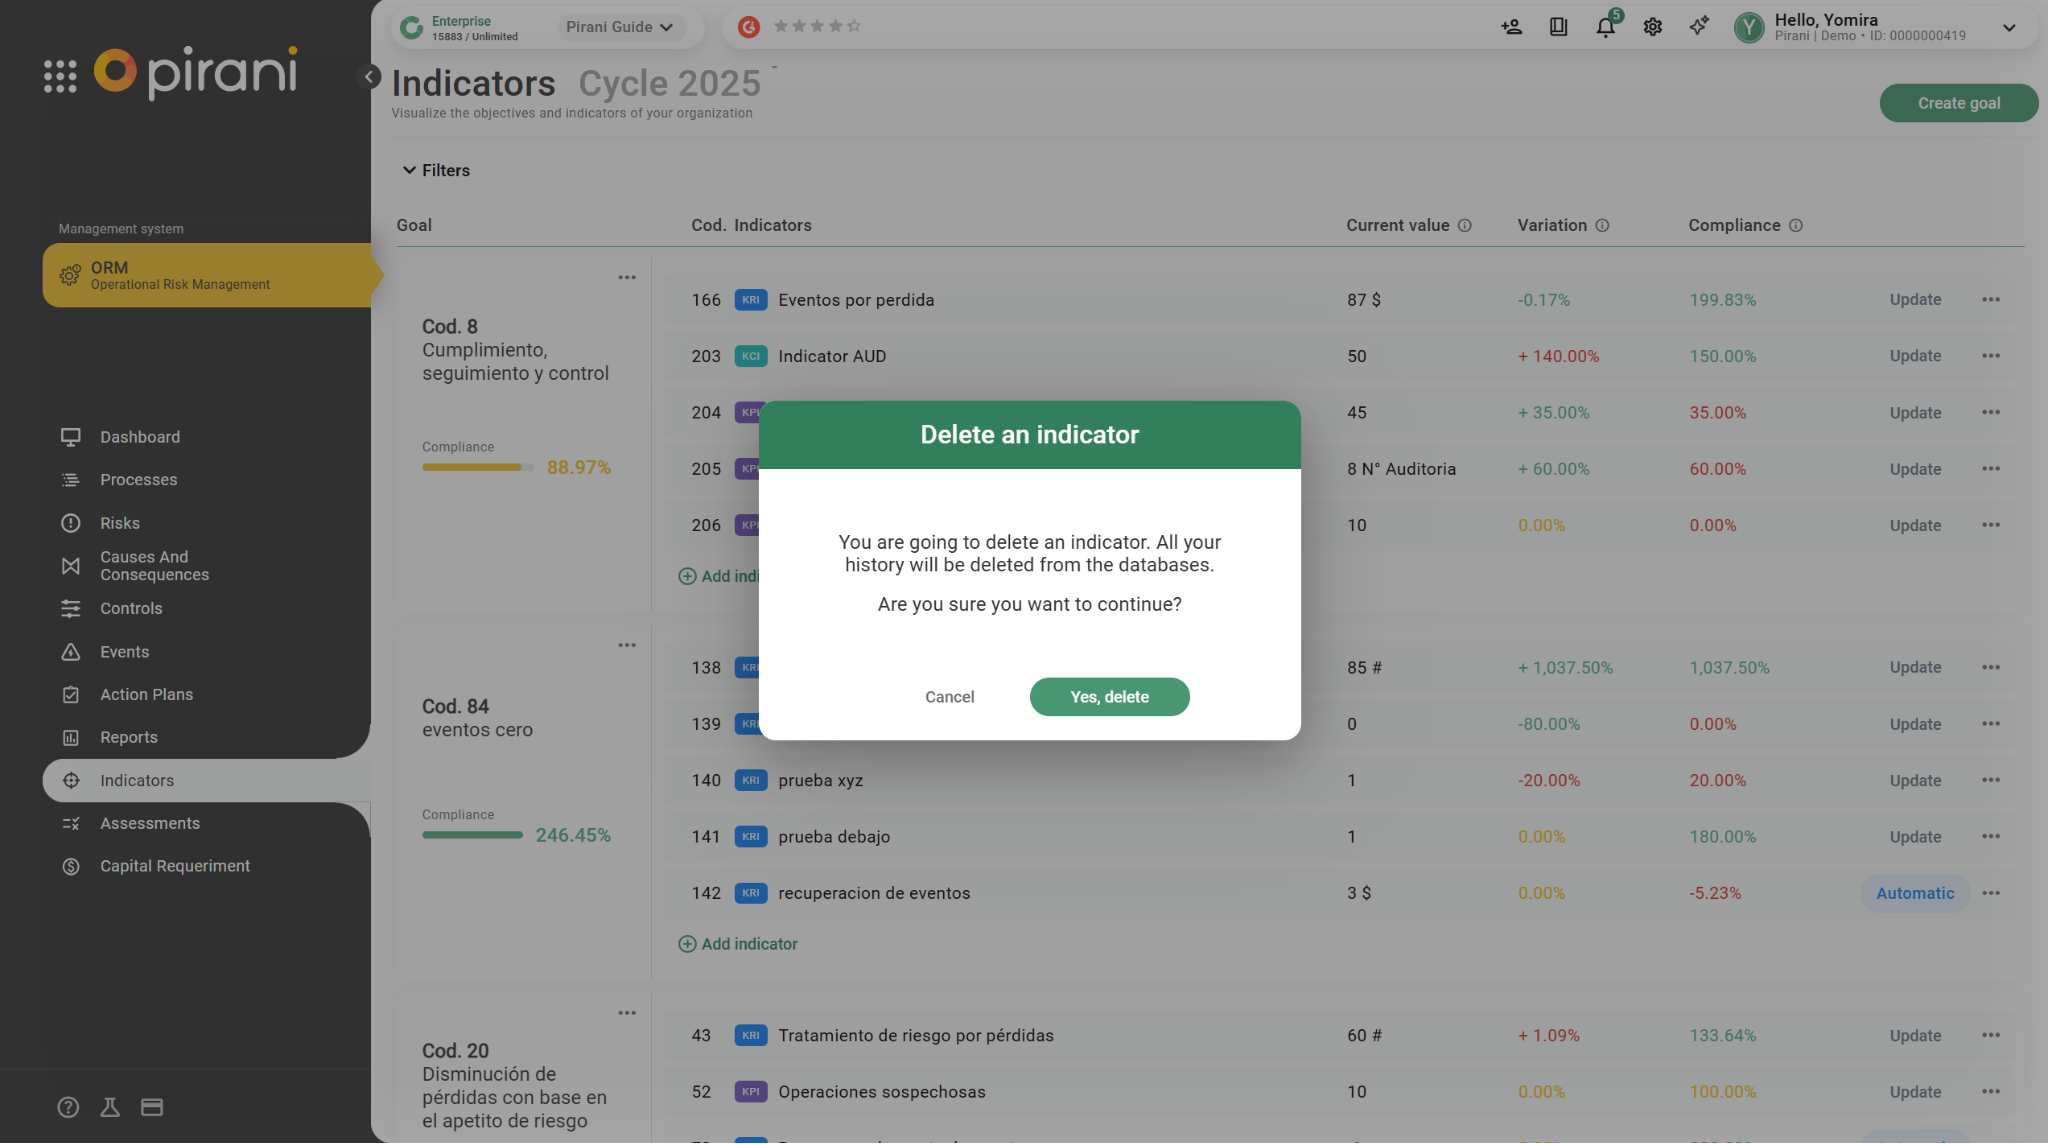
Detail: you will see the history of the indicator and you will be able to compare it with the previous year.
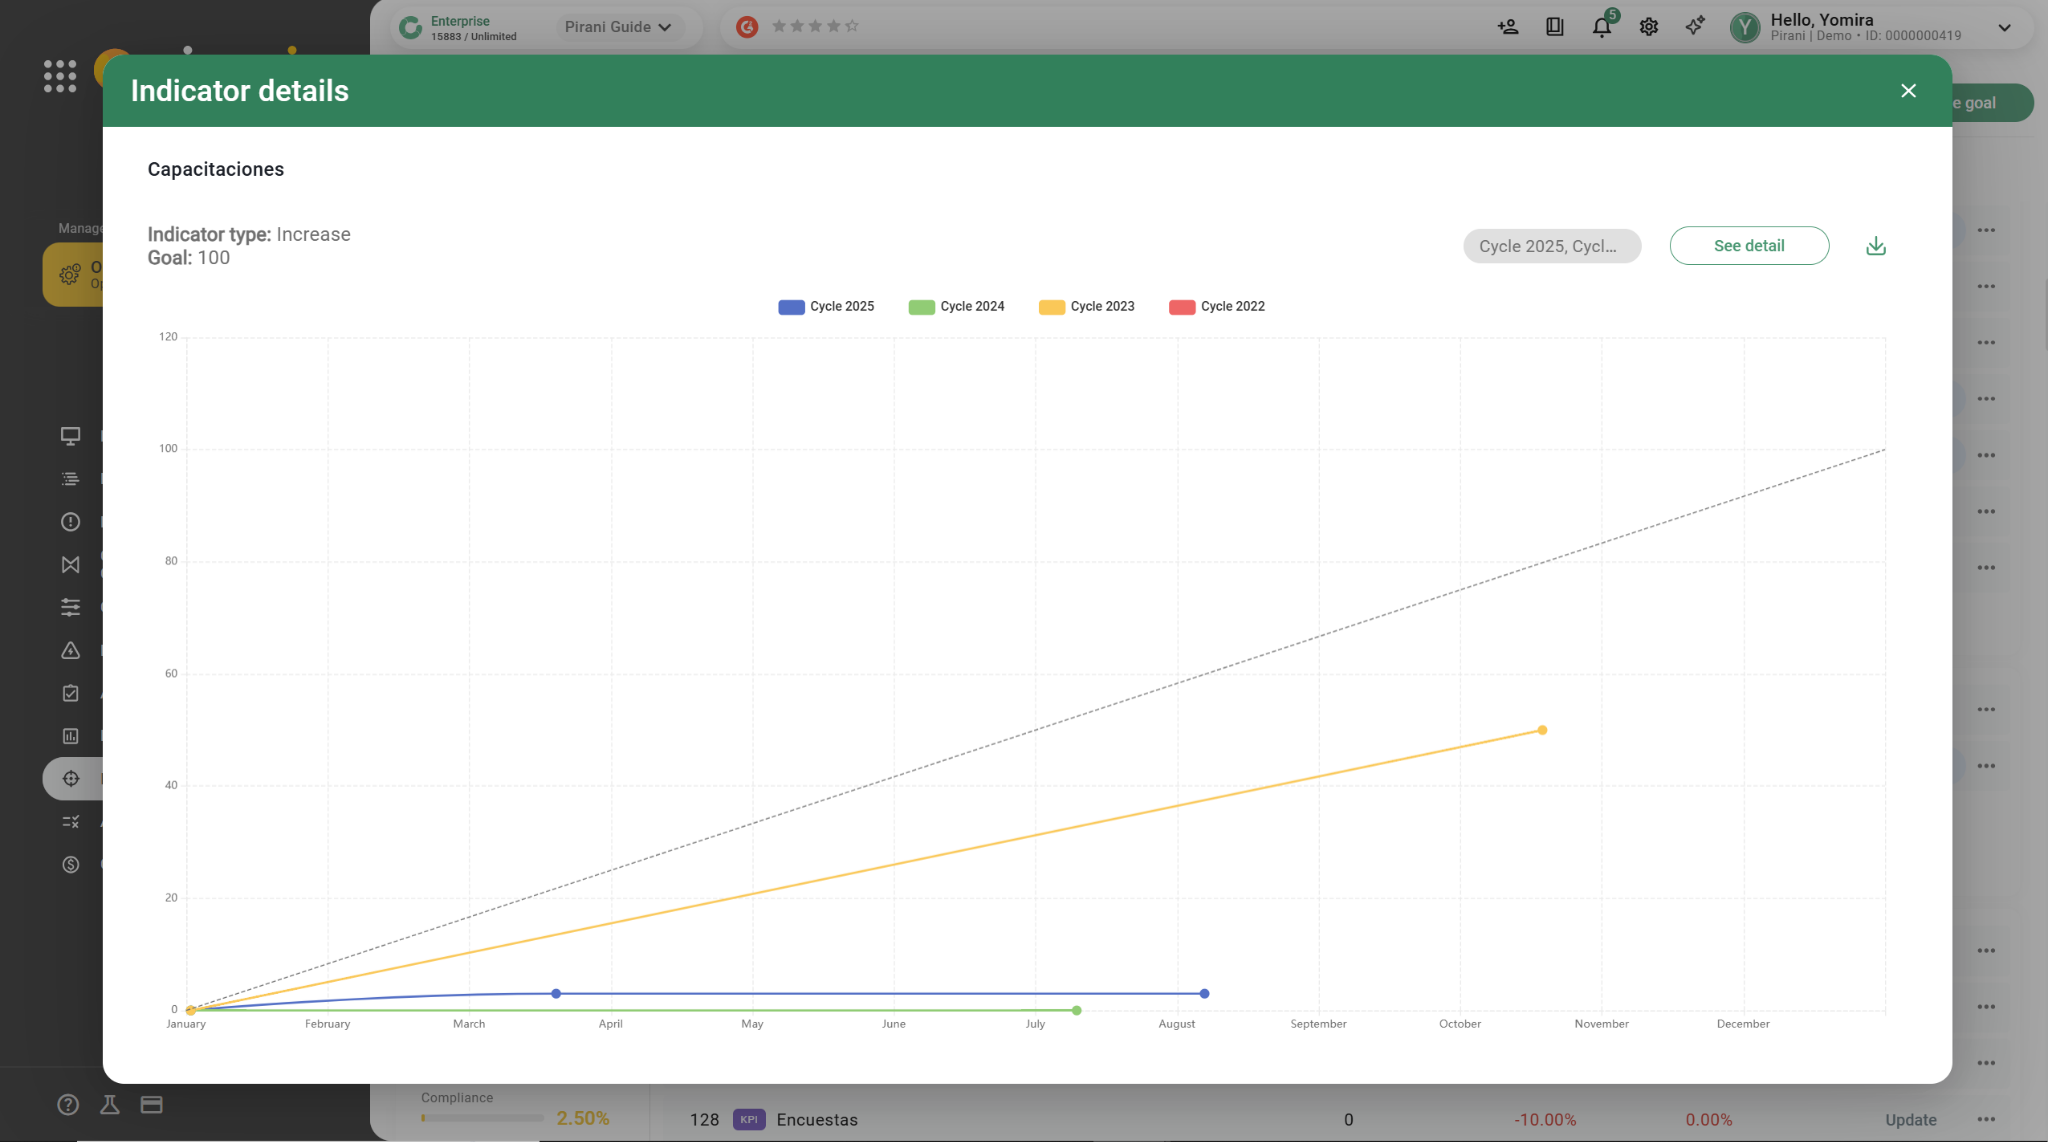
How to read the chart in "Detail"?
The chart illustrates the historical performance of the indicator, along with each update recorded throughout the year, in relation to the established target. In this example, the indicator is expected to show growth; therefore, the target is represented by the dashed line, while each data point on the chart corresponds to individual updates reflected in the indicator’s current value.
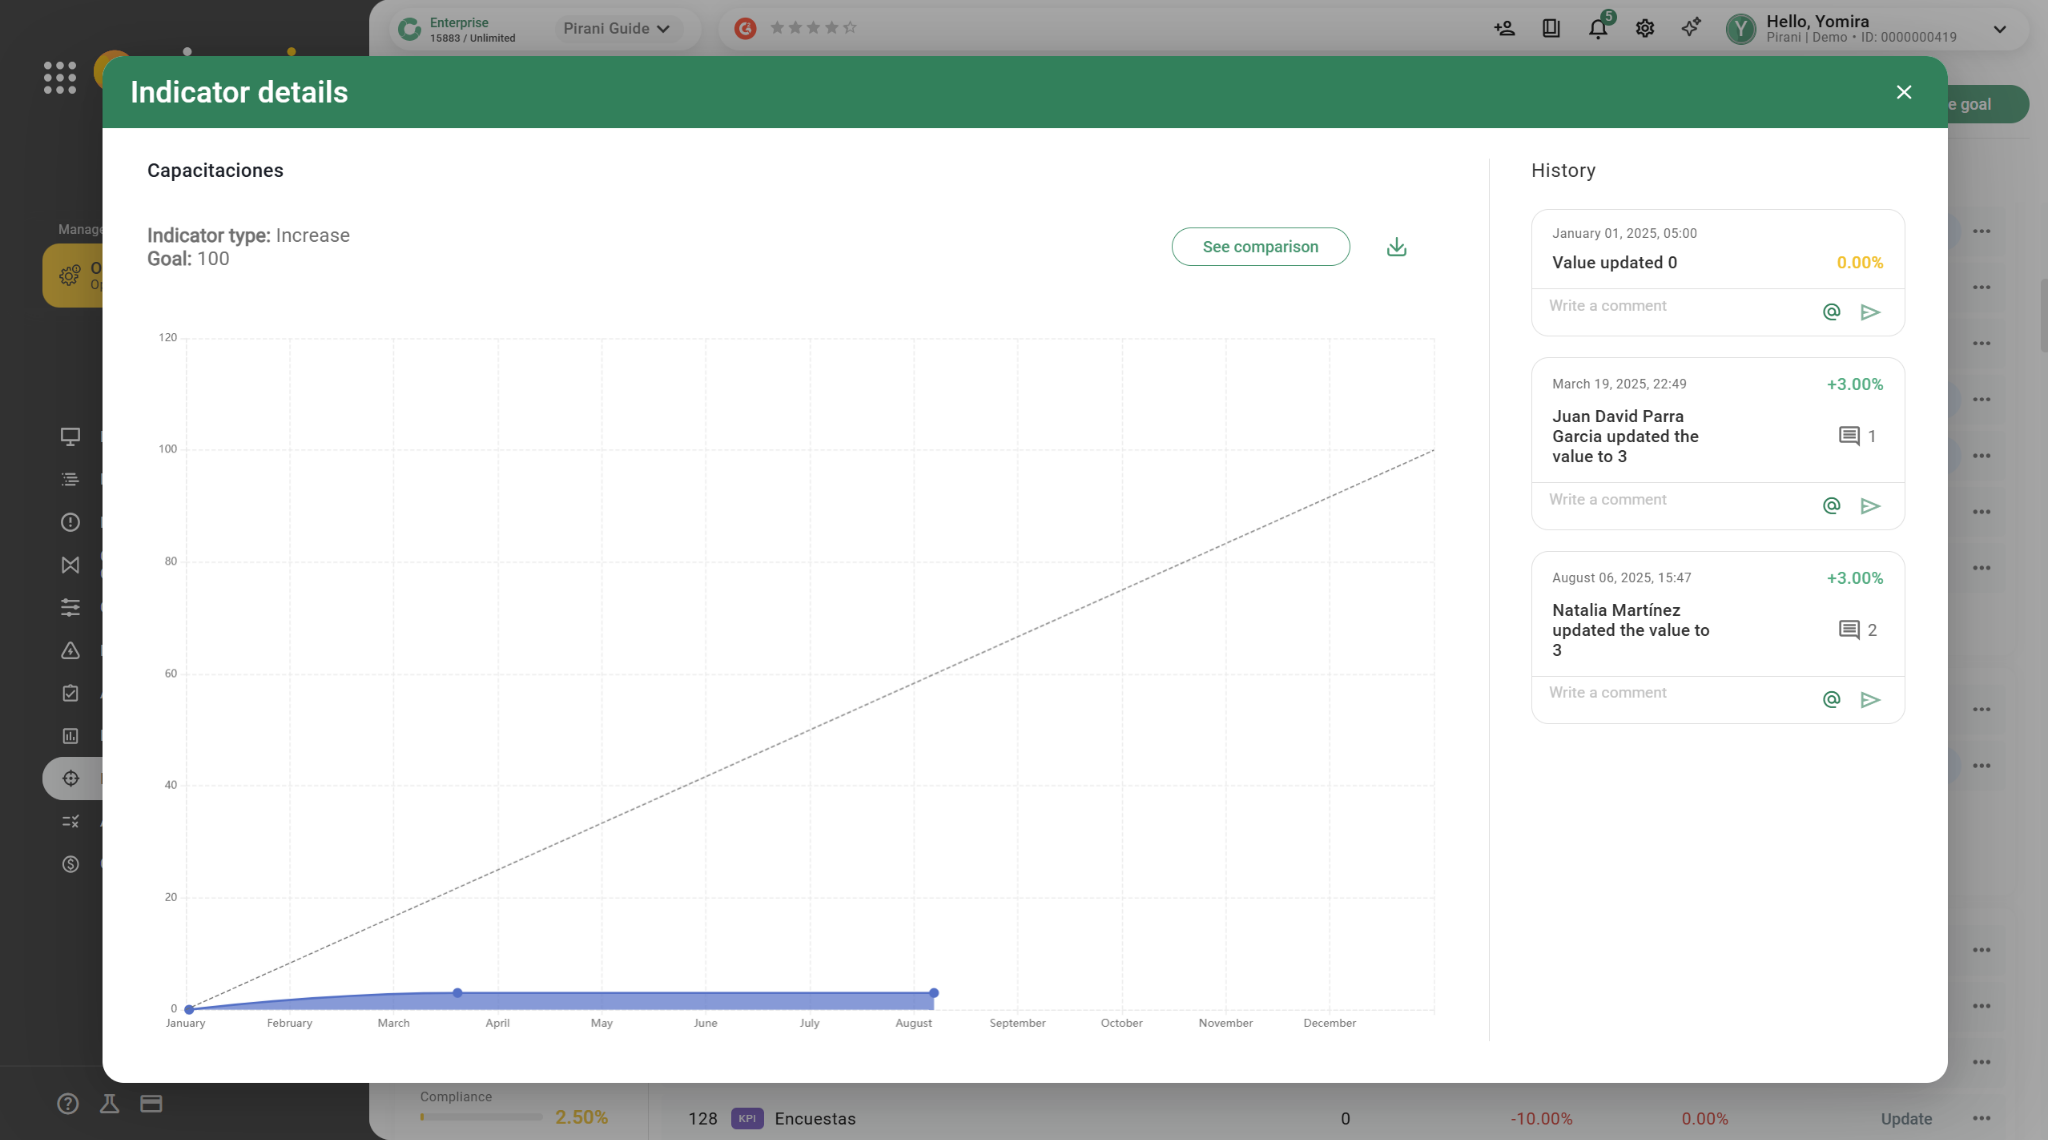
On the right side of the chart, you can view the historical record, which displays the recorded value, date, and corresponding comments. Finally, you will find a comparative view of the chart that contrasts all records from the previous year with those from the current year.
In addition, you will be able to download the two indicator reports, just click on the down arrow icon and you will have a PDF report with all the information.