With Pirani, you can use the Dynamic Reports module to build reports related to your organization's risk management, applying specific filters and downloading them instantly in formats such as .xls or .png.
This type of report will be available across all management systems (ORM, ISMS, Compliance, AML, and Audits) that you have in the tool, and you will be able to find it within the “Reports” module.
→ Note: This feature is available in both the Enterprise and Free plans.
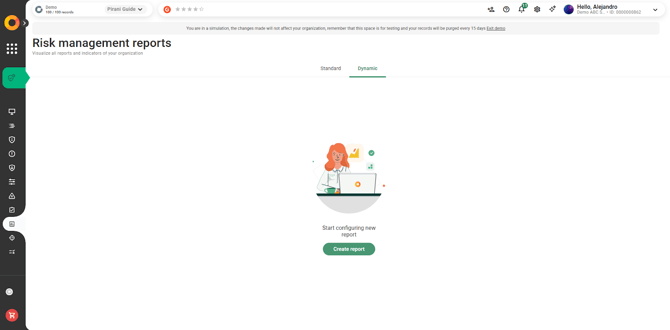
How to Create a Dynamic Report?
Within the “Reports” module, you’ll find a green bar at the top labeled "Dynamic" — click the “Create” button.
Here, you can create your reports in two formats:
-
Data Table
This option provides basic filters that you can adjust according to your needs.
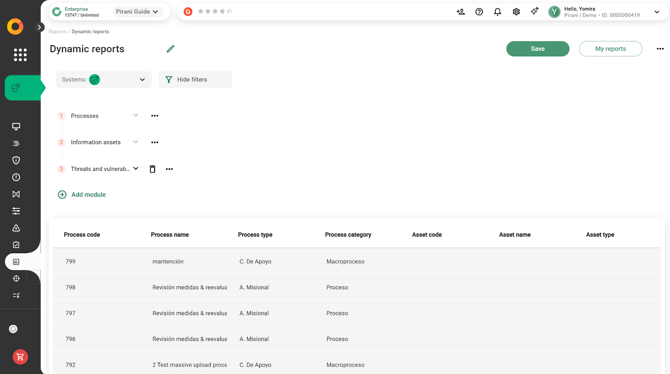
Once you've configured the filters, the results will be displayed below, divided into columns and based on the current date.
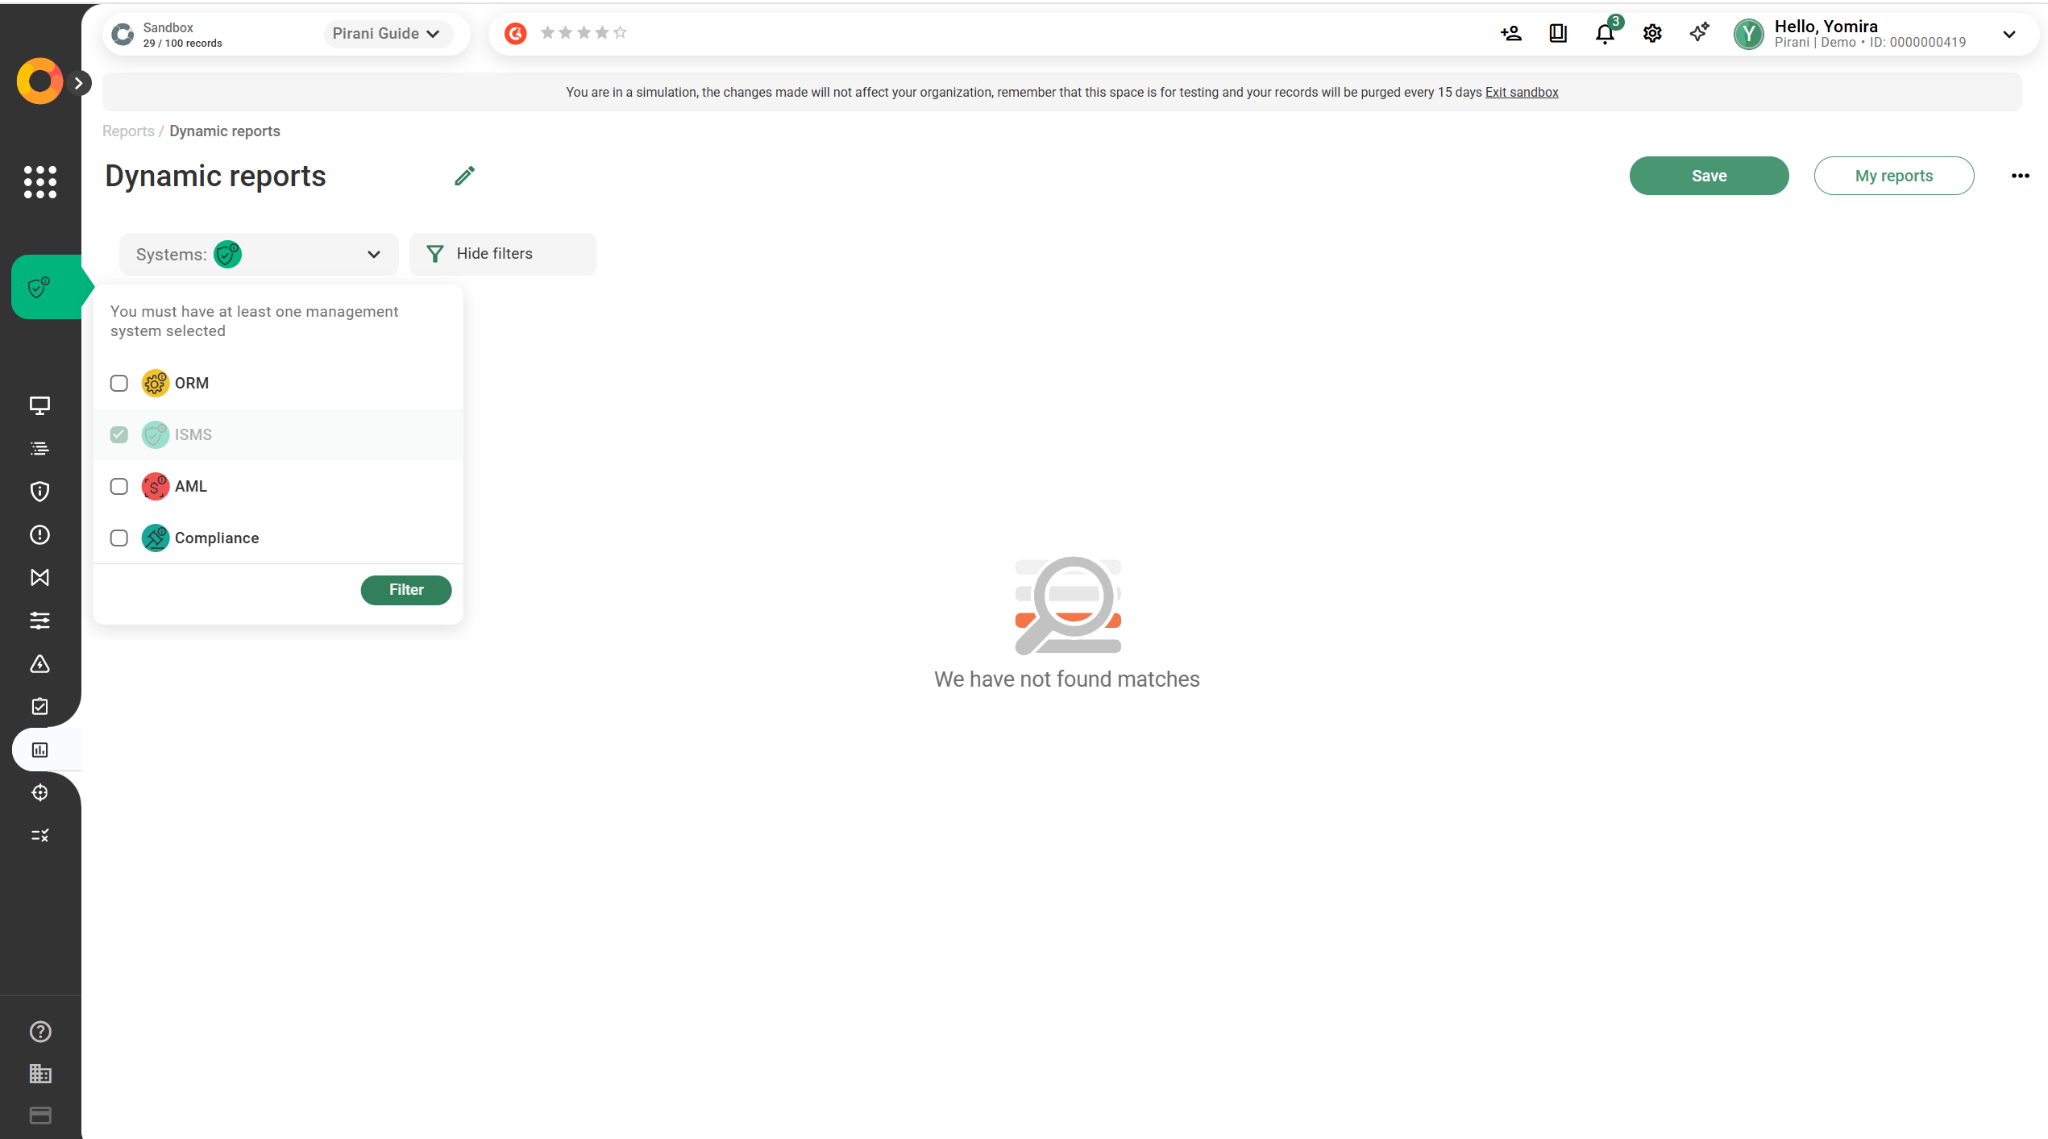
How Can I Filter Report Creation by Management Systems?
Since this module is cross-functional, you can select one or several management systems to generate your reports.
To do so, go to the upper left corner of the module, in the “Systems” filter, where you’ll find the following options:
ORM, ISMS, AML, and Compliance.
Select the systems you wish to include and click on “Filter” to generate the report.
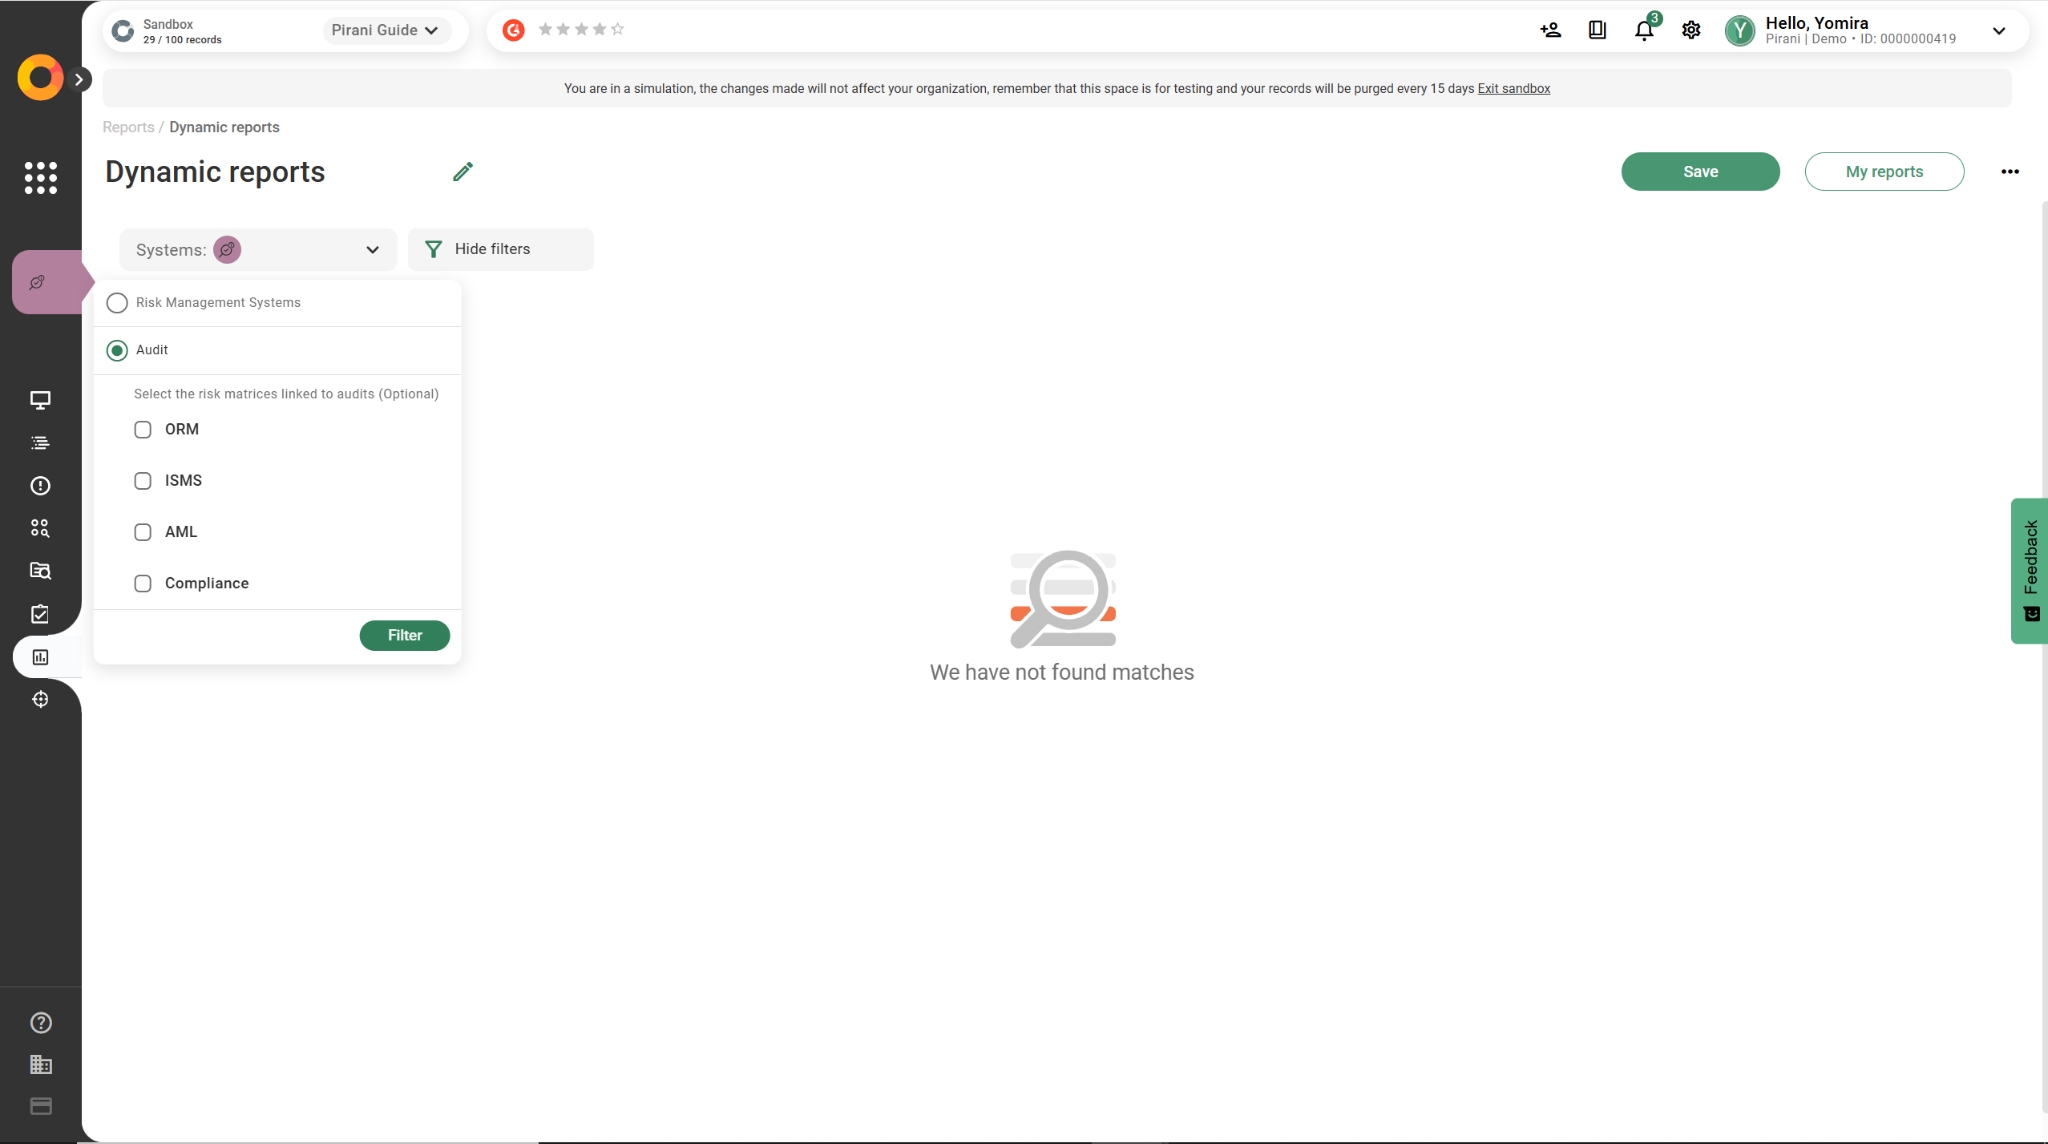
⚙️ In the case of “Audits”, the filter will appear differently: you’ll be able to select the risk matrices linked to the audit (this selection is optional).
⚠️ Important: If you select two or more management systems, the report will display only the modules that are shared across them.
Systems (ORM, ISMS, AML & Compliance)
Audit
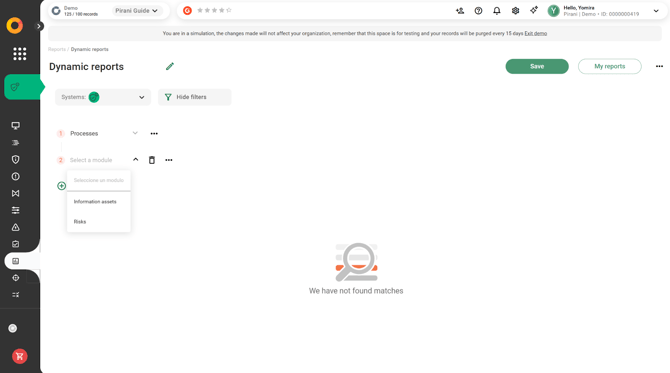
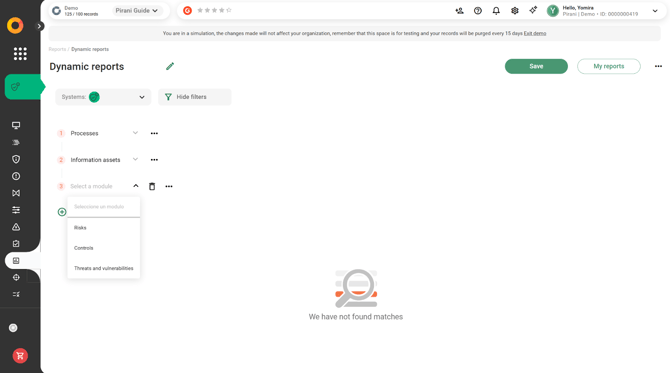
As the next step, choose the module, here you will be able to filter by the associations that module has. Let’s take an example:
If we select the ISMS management system, it will allow us to filter the report according to the modules that this system contains (processes, information assets, risks, controls, incidents, and action plans).
If we choose the Processes module, the next filter will show everything that is associated with this module, that is: Information Assets and Risks.
And... how can you know what each module is associated with?
You can go to that module and enter the “Associations” section, where you will see which modules it is related to.

Let’s continue with the example:
If you choose to filter Processes by Information Assets, the associations that this module has will appear, that is: Threat and Vulnerability and Risks.
The relationship with Processes will not appear since it was selected as the main filter
Additionally, if you want to filter by a person-type filter, you can select the user.

Add columns
Another important point is that you will be able to select which fields you want to extract for the report. You can find this option to the right of the filter you selected, under “Add columns.”
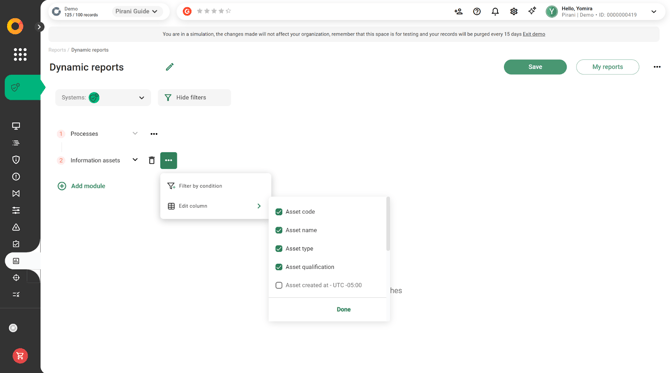
Additionally, you will have the possibility to sort the fields as you wish by selecting and dragging them.
Filter by condition
You will have the option to filter, for each module, the conditions you want in the report. For example, if you are filtering by the Risks module, you can apply the condition filter if you only want to see those risks that have a low residual risk level.
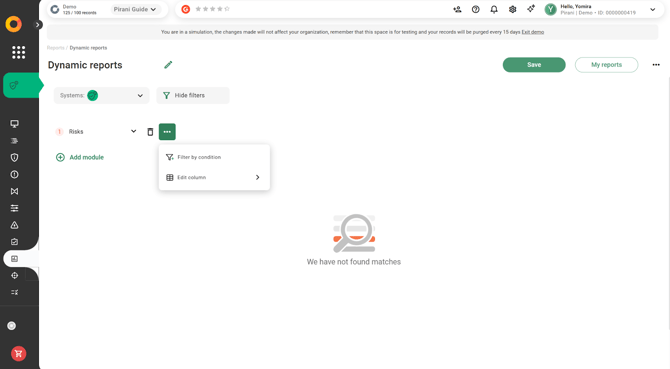
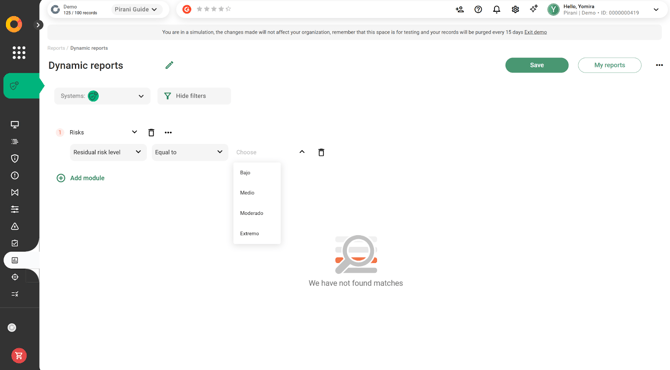
You can find this option in the filter icon located immediately after the module you selected. Add all the condition filters you find appropriate, but remember that as you add more filters for each module, the number of results will decrease since all previous conditions must be met.
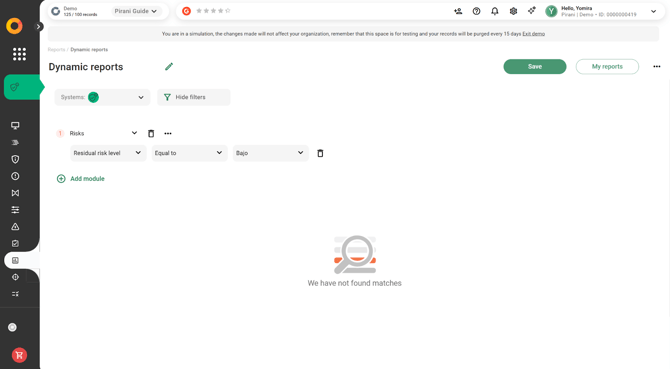
Remove filters
You can remove any filter by clicking the trash bin icon at the end of each condition.
- Chart
This report has a structure similar to the Data Table filters; the difference is that the information will not be tabulated but displayed in charts according to the filters you have selected. It is also important to mention that the data that can be filtered must be quantitative, as qualitative data cannot be graphed.
⚠️ Important: In this type of report, if you select all management systems, all modules will appear since each piece of information is independent.
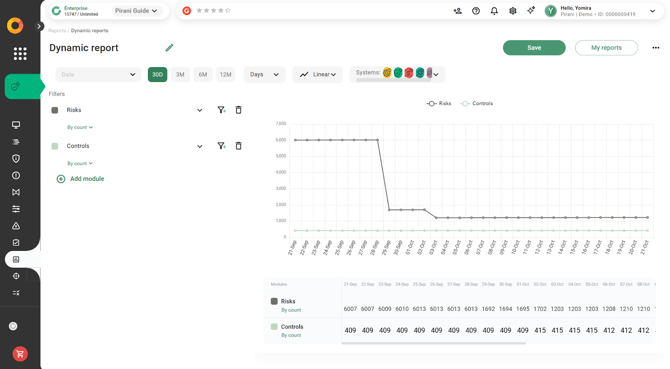
How to Filter the Chart Report?
The chart report aims to analyze comparisons between data (unlike the Data Table report, which relates data through filters). For example, you can compare how many risks you have identified versus how many action plans you have as of today.
You will also have a table below the chart where you can see the same information in tabulated form.
Filter by condition
You will be able to filter each module with various conditions to compare it against other modules or against the same module with different conditions. Let’s take two examples:
1.To compare it against another module: You can filter the Risks module by low inherent risk level against the total number of existing controls.
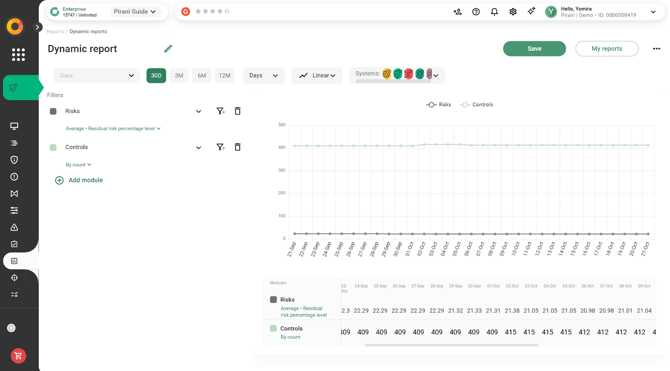
2.To compare it against the same module: You can filter the Risks module by count against the maximum percentage of inherent risk impact.
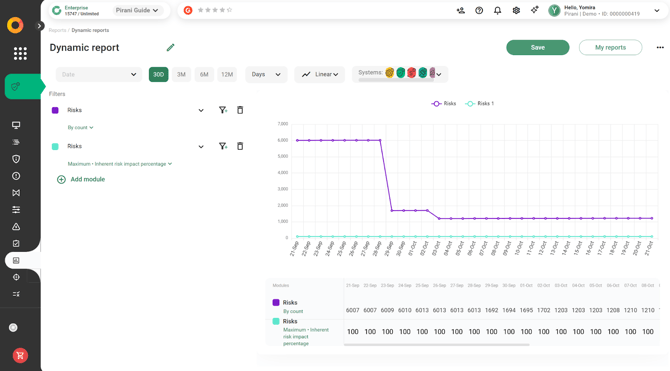
Chart Types
Visualize your chart in any of these three formats: line, bar, or pie (the last option can only be enabled when the filter is by count).

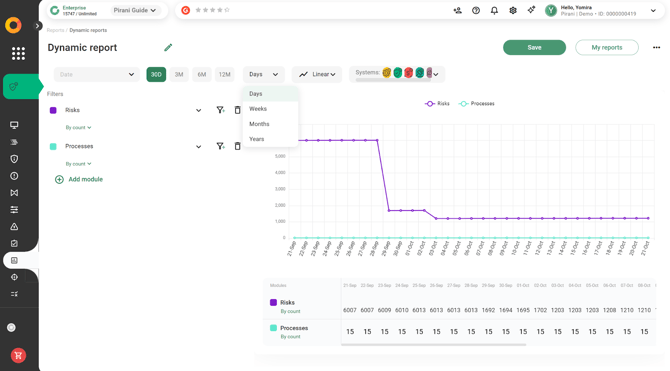
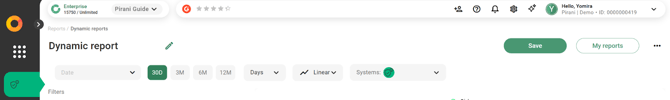
Date Filter
Above the chart, you will find a section that allows you to filter by an exact date range, days, weeks, months, or years. This will make the tool organize the data according to the filter you choose.
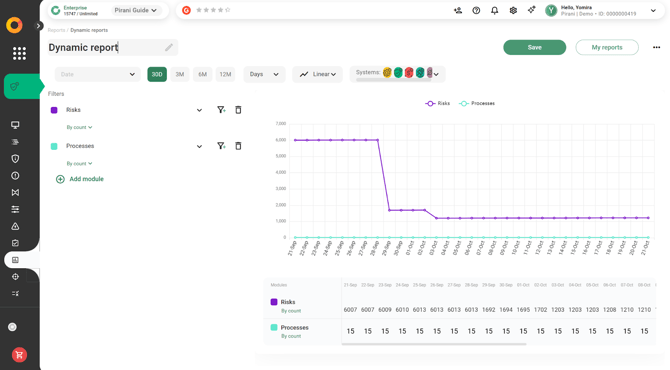
How to Assign a Name to a Report?
You can change the name of your report by clicking on the current title, and if you want to save the changes, select the “Save” button located at the top right.
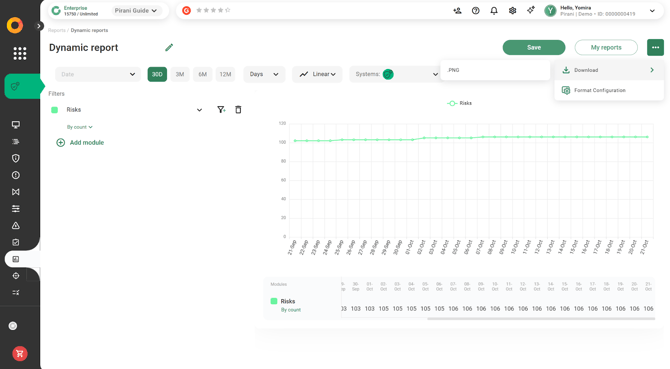
How Do I Download My Report?
At the top right, you will find the “Download” button.
If your report is in Data Table format, you will have the option to download it as an Excel file, and if it is in Chart format, you can download it as a PNG.

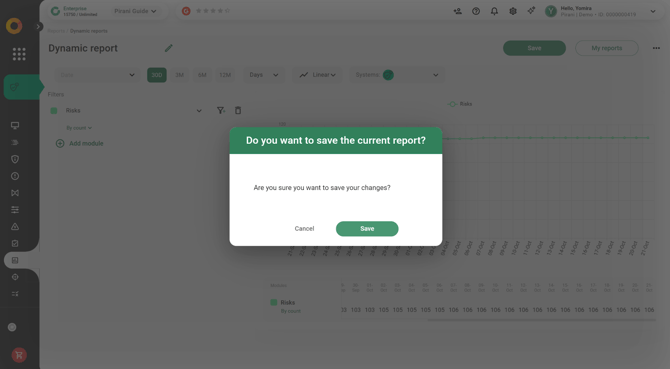
How Do I Save My Report?
At the top right, you will find the “Save” button. This will allow you to keep it as a template in the My Reports section.
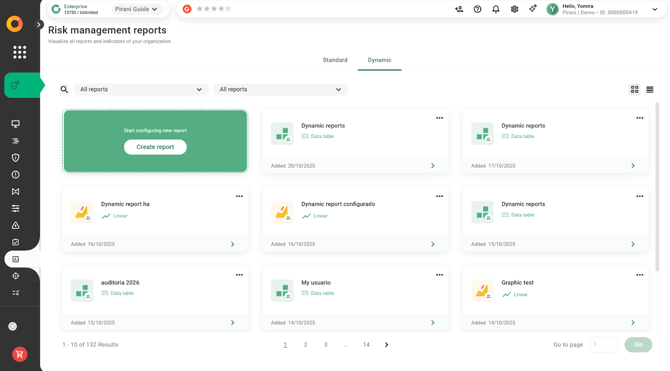
How to Easily Access My Reports?
If you saved your reports, you can easily find them in the “Reports” module by clicking the “My Reports” button. Here, you will see a list of the reports you created within the tool.
Favorite Reports
You can also add any report as a favorite or set it as the default by clicking the star that appears in the upper right corner of each report.
⚠️ Important: You can create as many reports as you consider necessary.
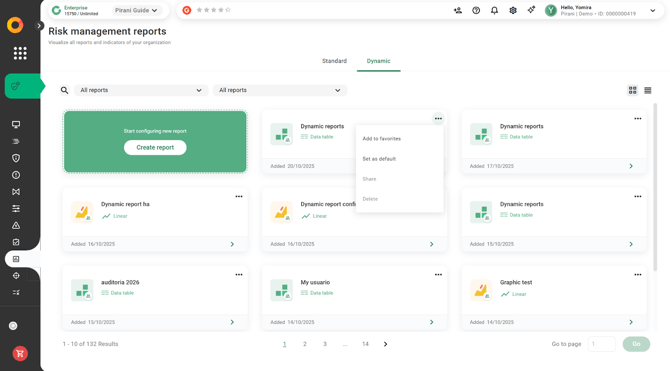
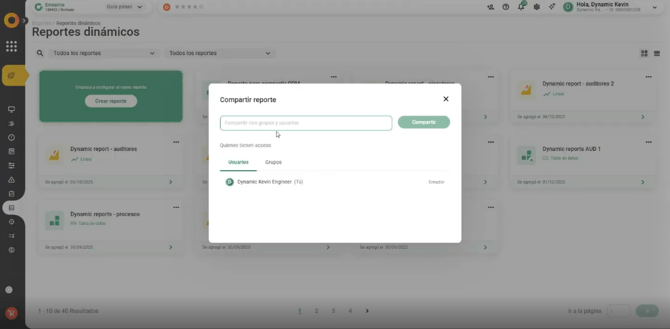
Sharing
This feature allows you to share information with specific people within the organization, ensuring the security and confidentiality of the data. Only authorized users will be able to view the corresponding information.

Once you select “Share”, you can share your report with users, to whom you can grant three permission options: reader, collaborator, and content administrator, or with groups of people.
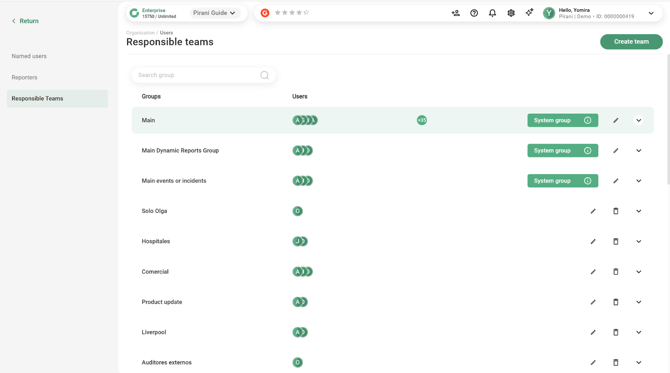
This group of people is added to the “Dynamic Reports Group.” To find it, you must go to “Manage Organization,” then “Organization Users,” where you will see the sections “Responsible Groups” and “Main Dynamic Reports Group.”
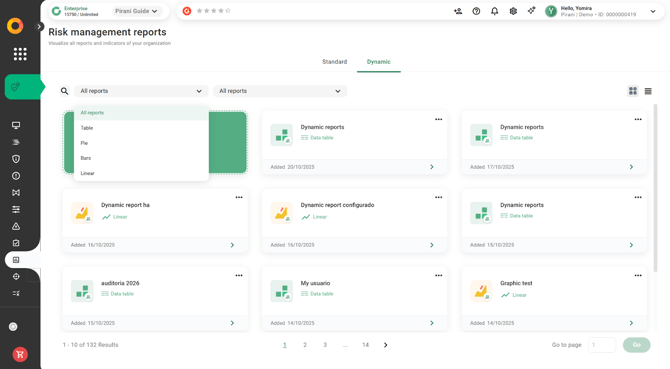
How Can I Filter My Reports?
You can filter by type: table, pie, bar, and line.
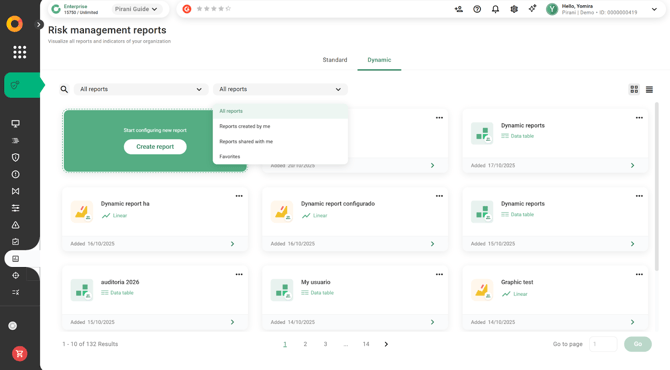
Additionally, you can also filter by reports created by you, reports shared with you, and favorites.
How to View Report History?
Go to the “My Organization” section located at the top right of the tool and click on “Audit Log.” Here, you can filter by the “Reports” module and select by action, responsible user, system, and/or date.
Don’t forget to rate us 👇. Your feedback is very important!